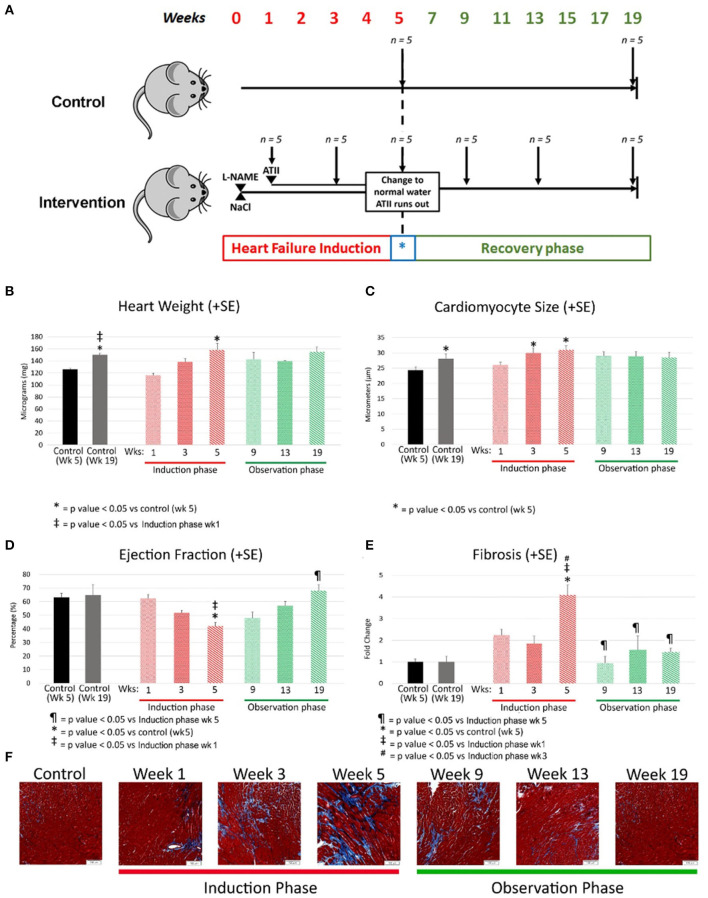
Figure 1.
(A) Experimental model where C57/BL6 mice underwent heart failure induction over first 5 weeks followed by removal of heart failure-inducing agents (marked with a blue *) with a passive observation phase up to a total of 19 weeks. Each group had 5 mice and were sacrificed at the time points indicated by a downward arrow. L-NAME and NaCl were administered in drinking water and angiotensin II delivered by osmotic mini-pumps. L-NAME, NG-nitro-L-Arginine Methyl Ester; NaCl, Sodium Chloride; ATII, Angiotensin II. (B–E) Morphological changes at various time points 2 weeks apart during heart failure induction and recovery phase after removal of heart failure-inducing agents. The bar graphs represent heart weight in milligrams (B), cardiomyocyte size in micrometers (C), ejection fraction as percentage (D) and fibrosis as fold change (E). Red represents the heart failure induction phase and green represents the observation phase after removal of heart failure-inducing agents. Controls are represented in different colors to represent age matched controls for both time points. (F) Are representative photomicrographs of mouse cardiac with Masson's trichrome staining reflecting the gradual increase of fibrosis (by week 5) followed by a resolution of the same during the observation phase (recovery). L-NAME, NG-nitro-L-Arginine Methyl Ester; NaCl, Sodium Chloride; HF, Heart failure; Wks, weeks.

