Figure 2.
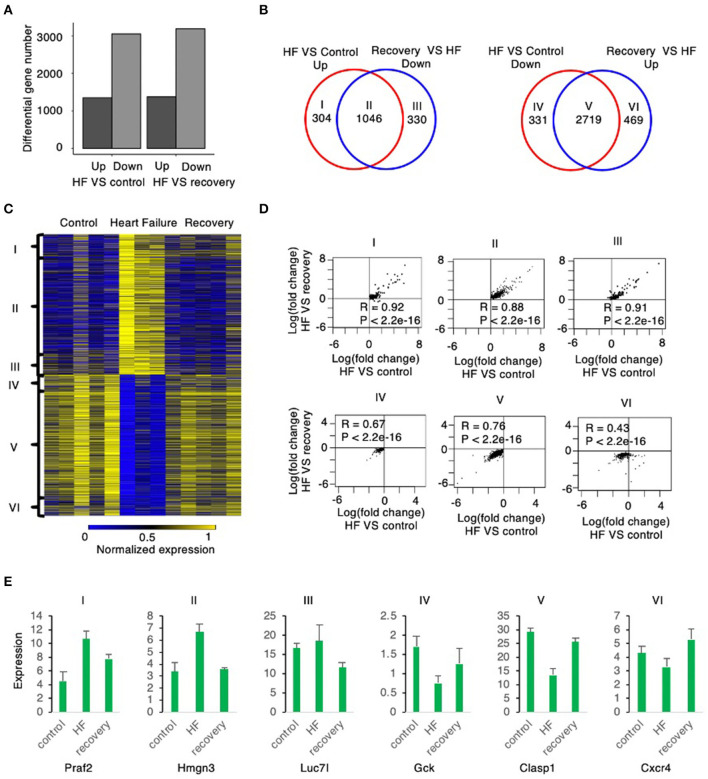
Global gene expression changes from mouse myocardium samples from control to heart failure and recovery. (A) The number of up and down regulated genes in heart failure relative to control are similar to the number of up and down regulated genes in heart failure relative to recovery suggesting that recovery is similar to control state. (B) The up regulated genes in heart failure relative to control correlate highly with the down regulated genes in recovery relative to heart failure (group II). The down regulated genes in heart failure relative to control correlate highly with the up regulated genes in recovery relative to heart failure (group V). Group I and group IV reflects number of genes that are up and down regulated, respectively, in HF compared to control (without a correlation to those reverting back to control state in recovery); Similarly, Group III and group VI are No. of genes that are down and up regulated, respectively, in recovery compared to HF (without a correlation between control and HF). (C) The heatmap shows the expression level of the six groups defined above. (D) The scatter plot of each group shows the expression change in heart failure relative to control is strongly correlated with the expression change in heart failure relative to recovery. (E) The boxplots show the expression level of example genes in each of the 6 groups described above.

