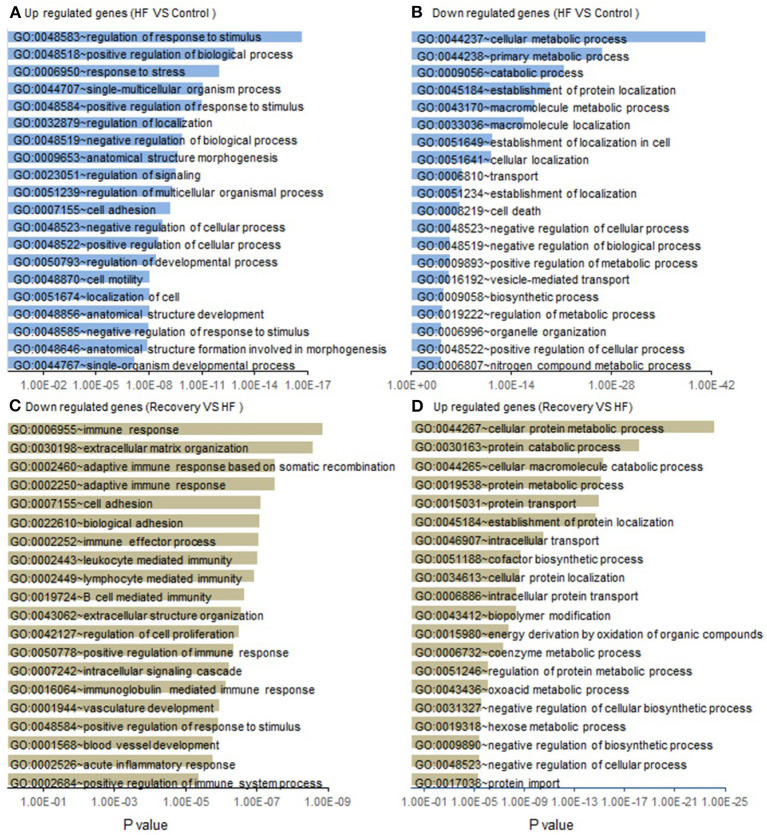
Figure 3.
List of functional GO pathways of gene changes from control to heart failure and recovery. Assessment of gene expression changes in Heart failure (Week 5) compared to controls show (A) 1,350 Up regulated genes enrich into a total of 95 GO pathways of which the top 20 most significant are shown; (B) 3,050 down regulated genes enrich into a total of 46 GO pathways and top 20 most significant are shown. Functional GO pathway assessment of gene expression changes in Recovery (Week 19) compared to Heart failure (Week 5). (C) 3,188 down regulated genes enrich into a total of 185 GO pathways of which the top 20 most significant are shown. (D) 1,376 up regulated genes enrich into a total of 146 GO pathways and top 20 most significant are shown. p-value is statistical significance.

