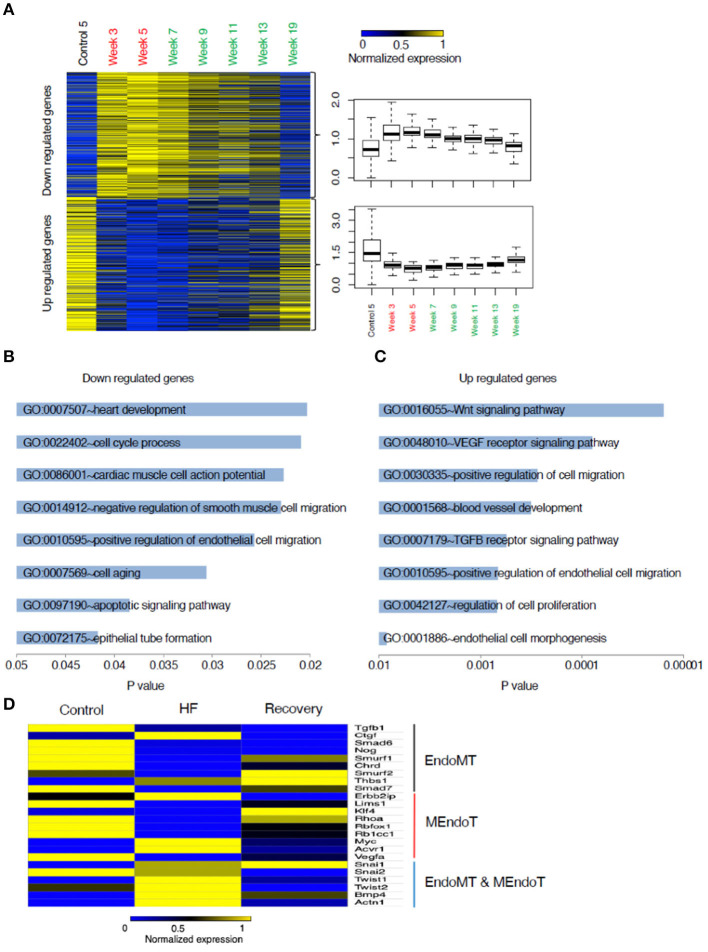
Figure 4.
Analysis of genes that changed from control to heart failure and reverted to control state in recovery. (A) Heat map of these genes categorized into those up regulated in heart failure compared to control followed by reverting to a lower expression in recovery and those down regulated in heart failure compared to control followed by reverting back up in the recovered state. (B) List of the most relevant biologically meaningful GO pathways that suggested epithelial/endothelial and mesenchymal transitions into which the genes that were up regulated in heart failure cohort into and those (C) representing genes that were down regulated during heart failure. (D) Relative changes in gene expression of a list of 24 genes that were identified from literature search as those that play a role in endothelial and mesenchymal cell transitions. The heat map represents changes in gene expression from control to week 5 (representing heart failure) and week 19 (representing recovery). Yellow represents a relative increased expression and blue a decreased expression.

