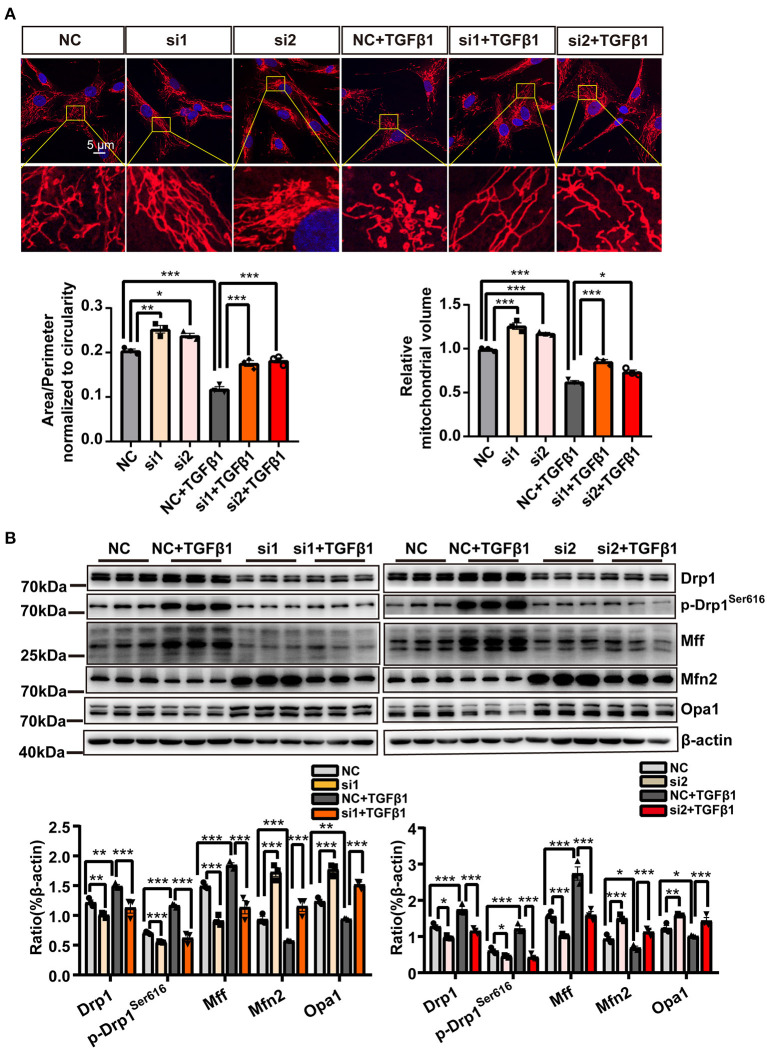
Figure 6.
Inhibiting mitophagy suppressed mitochondrial fission. (A) MitoTracker Deep Red staining in cardiac fibroblasts (CF) transfected with either Pink1 siRNA or negative control (NC) and exposed to TGF-β1. (B) Immunoblotting analysis, with quantification, of mitochondrial fission- and fusion-related proteins among the different groups. Data are shown as mean ± standard error of the mean (n = 3 independent cell isolations per group). Means were compared by one-way ANOVA, followed by the Student–Newman–Keuls (SNK) post hoc test. *P < 0.05; **P < 0.01; ***P < 0.001.

