Figure 4.

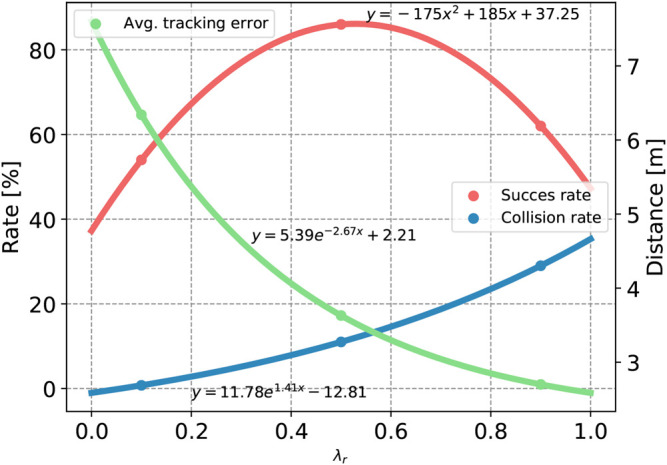
Curve-fitted data from Table 4. The average tracking error and the collision are fitted to exponential functions, while the success rate is fitted to a quadratic polynomial.

Curve-fitted data from Table 4. The average tracking error and the collision are fitted to exponential functions, while the success rate is fitted to a quadratic polynomial.