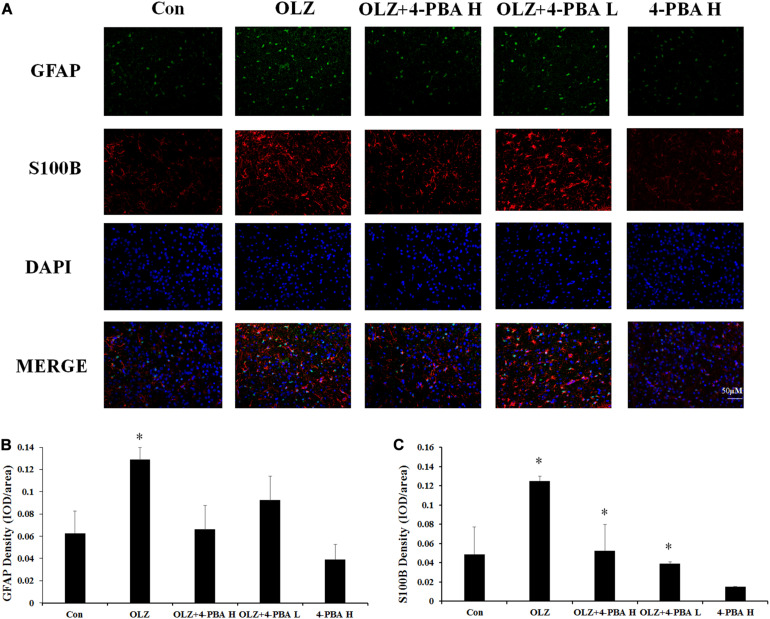
FIGURE 10.
Effects of 8-day olanzapine and 4-PBA co-treatment on GFAP and S100B fluorescence intensity in the rat hypothalamus. (A) Double-labeling with GFAP (green), S100B (red), and nucleus (blue) in the hypothalamus after 8-day olanzapine or 4-PBA treatment. (B,C) Quantification of relative fluorescence intensity for GFAP and S100B. All data were presented as mean ± SEM. Statistical significance was defined as p < 0.05 (∗p < 0.05 vs. control). Con, control; OLZ, olanzapine.

