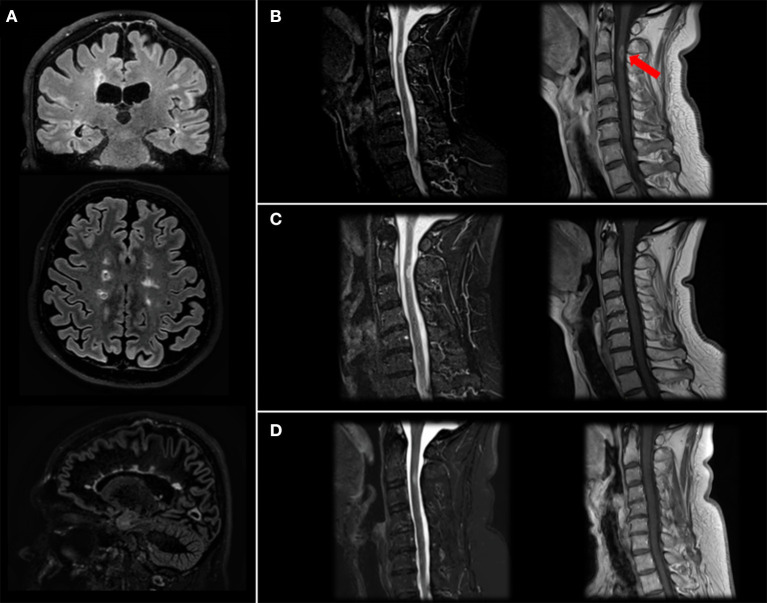
Figure 2.
Brain and spinal cord MRI. Brain MRI images (Fluid Attenutated Inversion Recovery coronal and axial projections, Double Inversion Recovery sagittal projection) showing typical MS lesions involving bi-hemispheric white matter (A). Cervical MRI image (Short Time Inversion Inversion Recovery and T1-gd+ sagittal projection) at diagnosis (B) showing a C2-C3 level lesion with gd-enhancement (arrow), resolution after steroid treatment (C) and stability at 4-month follow-up after two cycles of Rituximab (D).

