
Figure 5.
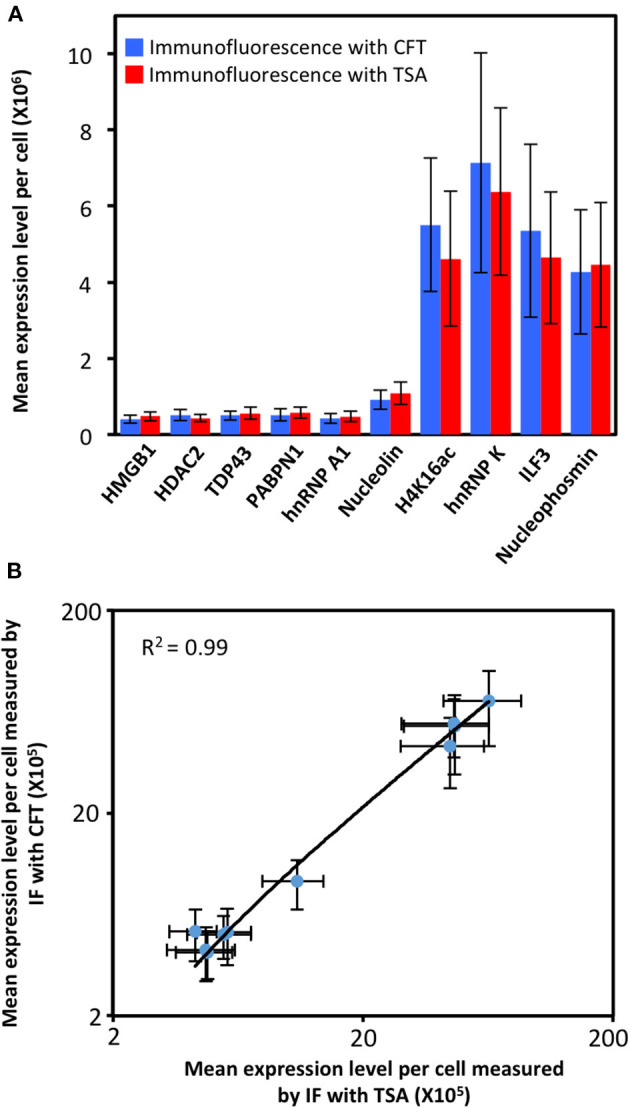
(A) Mean expression level per cell (n = 200 cells) of 10 different proteins measured by immunofluorescence (IF) with cleavable fluorescent tyramide (CFT) and conventional immunofluorescence with tyramide signal amplification (TSA). (B) Comparison of the results obtained by immunofluorescence with CFT and TSA yields R2 = 0.99 with a slope of 1.13. The x and y axes in (B) are on a logarithmic scale.