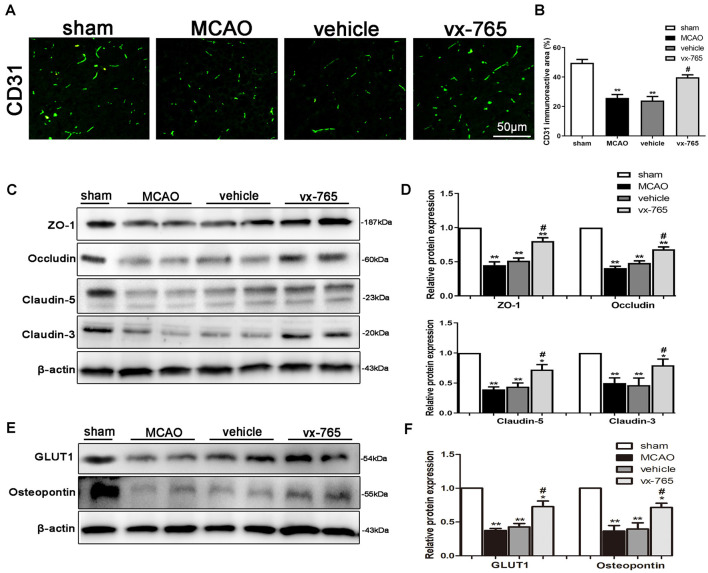
Figure 4.
Expression of tight junction (TJ) proteins after caspase-1 inhibition by vx-765, following ischemic stroke. (A) Immunofluorescence staining of CD31 (green) in the peri-infarct regions. Scale bar = 50 μm. (B) Fluorescence intensity and corresponding statistics. (C) Western blotting of the amount of zonula occludens-1 (ZO-1), occludin, and claudin-5 proteins in the peri-infarct area and (D) corresponding statistics. (E) Immunoblot images of the expression of glucose transporter protein-1 (GLUT-1) and osteopontin (OPN) in the peri-infarct regions, with (F) corresponding statistical analyses. Data are expressed as means ± SEM, *P < 0.05 and **P < 0.01, vs. sham; #P < 0.05, vs. vehicle, n = 6 per group.

