Figure 1.
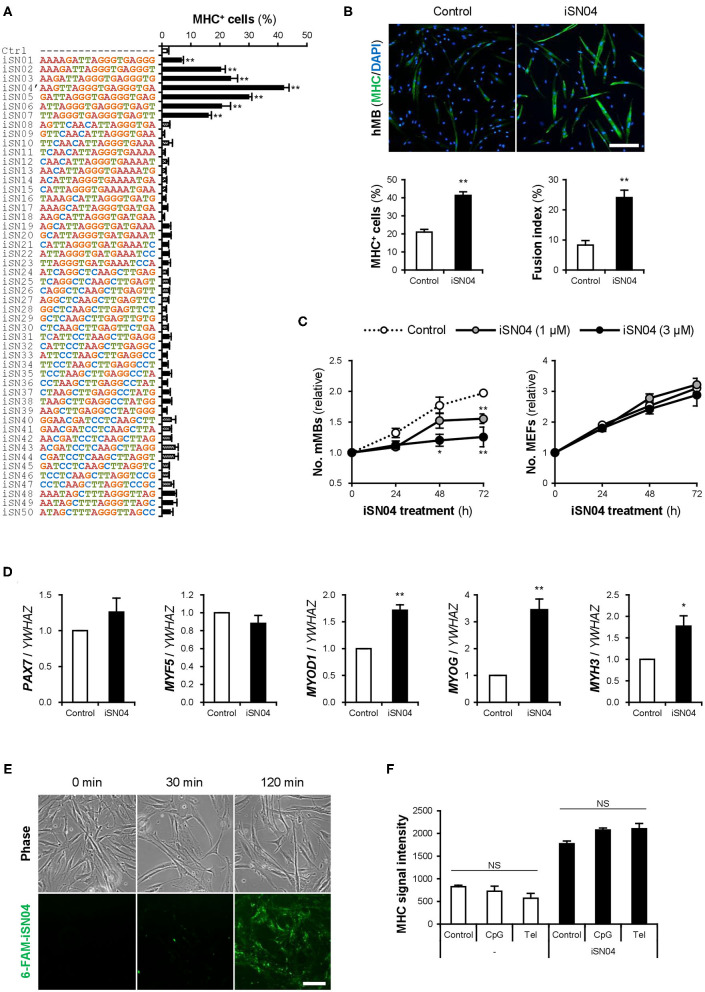
Identification of myoDNs. (A) Ratio of MHC+ cells within the screened mMBs treated with 10 μM PS-ODNs in GM for 48 h (screening system). **p < 0.01 (Dunnett's test). n = 3. (B) Representative immunofluorescent images of the hMBs treated with 10 μM iSN04 in DM for 48 h. Scale bar, 200 μm. Ratio of MHC+ cells and multinuclear myotubes were quantified. **p < 0.01 (Student's t-test). n = 6. (C) Relative numbers of the mMBs and MEFs treated with 1 or 3 μM iSN04 in GM for each cell. Mean value of the control sample at 0 h was set to 1.0 for each experiment. *p < 0.05, **p < 0.01 vs. control at each time point (William's test). n = 3. (D) qPCR results of myogenic gene expression in the hMBs treated with 30 μM iSN04 in DM for 24 h. Mean value of control hMBs was set to 1.0. *p < 0.05, **p < 0.01 vs. control (Student's t-test). n = 3. (E) Representative fluorescent images of the hMBs treated with 5 μg/ml 6-FAM-iSN04 in GM. Scale bar, 100 μm. (F) MHC signal intensities of the hMBs treated with 30 μM of iSN04, CpG-2006, or Tel-ODN in DM for 48 h (screening system). NS, no significant difference (Scheffe's F-test). n = 3.

