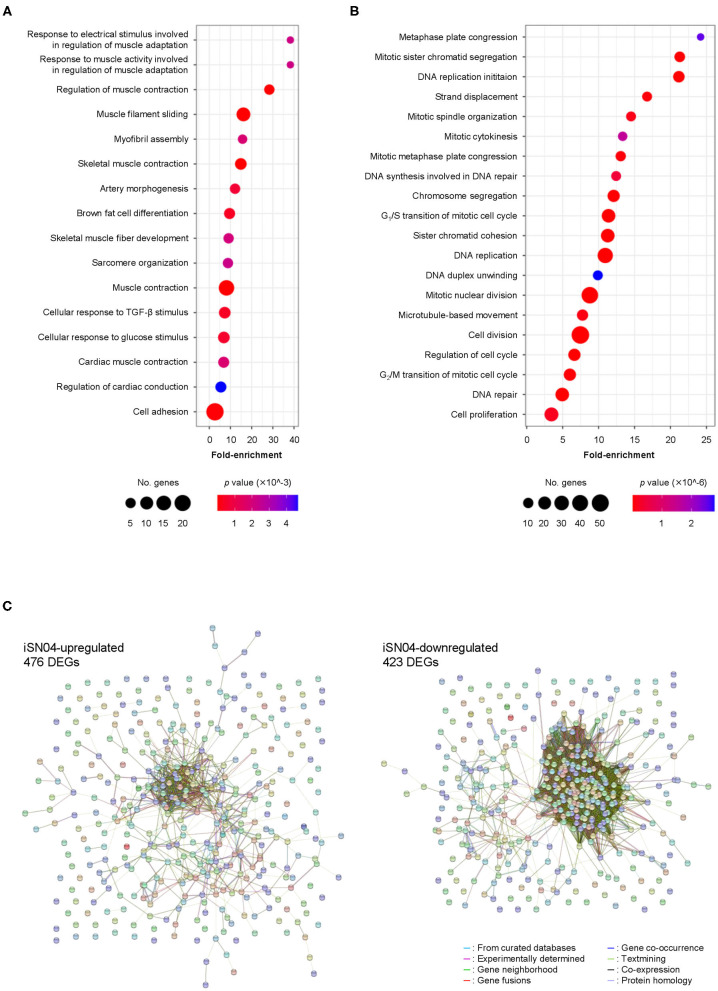
Figure 2.
Profile of iSN04-dependent gene expression. (A) Scattered plot of the 476 iSN04-upregulated DEGs significantly (p < 5.0 × 10⁻³) enriched in GO terms. (B) Scattered plot of the 423 iSN04-downregulated DEGs significantly (p < 5.0 × 10⁻⁶) enriched in GO terms. (C) Functional and physiological networks within the 476 iSN04-upregulated DEGs (left panel) and the 423 iSN04-downregulated DEGs (right panel) visualized via STRING analysis.

