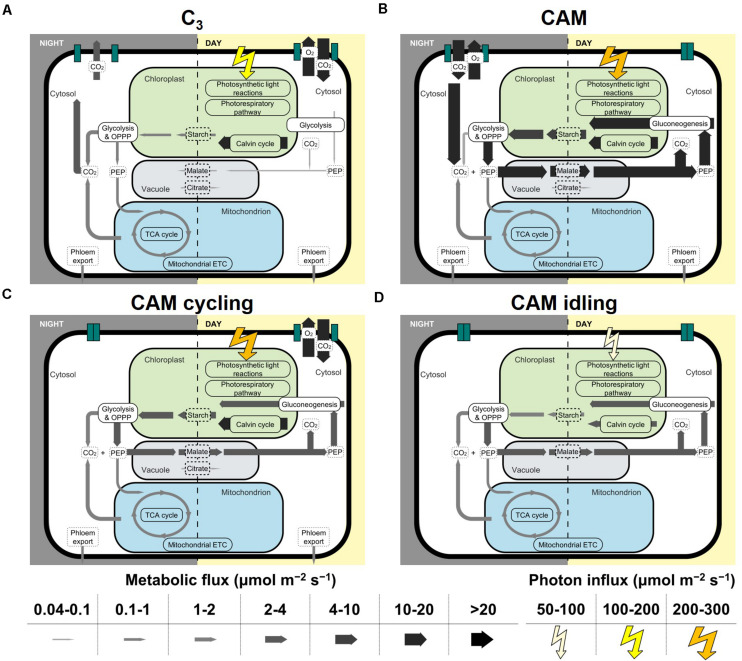
FIGURE 2.
Core sets of metabolic fluxes in the four modes of photosynthesis modeled: (A) C3, (B) CAM, (C) CAM cycling, and (D) CAM idling. The width of the arrows represents the magnitude of the reaction flux according to the scale on the bottom of the figure in μmol m–2 s–1. The photorespiratory pathway is shown in chloroplast for simplicity, which in reality spans multiple compartments. Flux from 3-phosphoglycerate to PEP was taken as the flux for glycolysis and gluconeogenesis. Flux for succinate dehydrogenase was taken as the TCA cycle flux. Note that only cyclic mode of the TCA cycle was shown. RuBisCO carboxylase flux was taken as the flux through the Calvin-Benson cycle.

