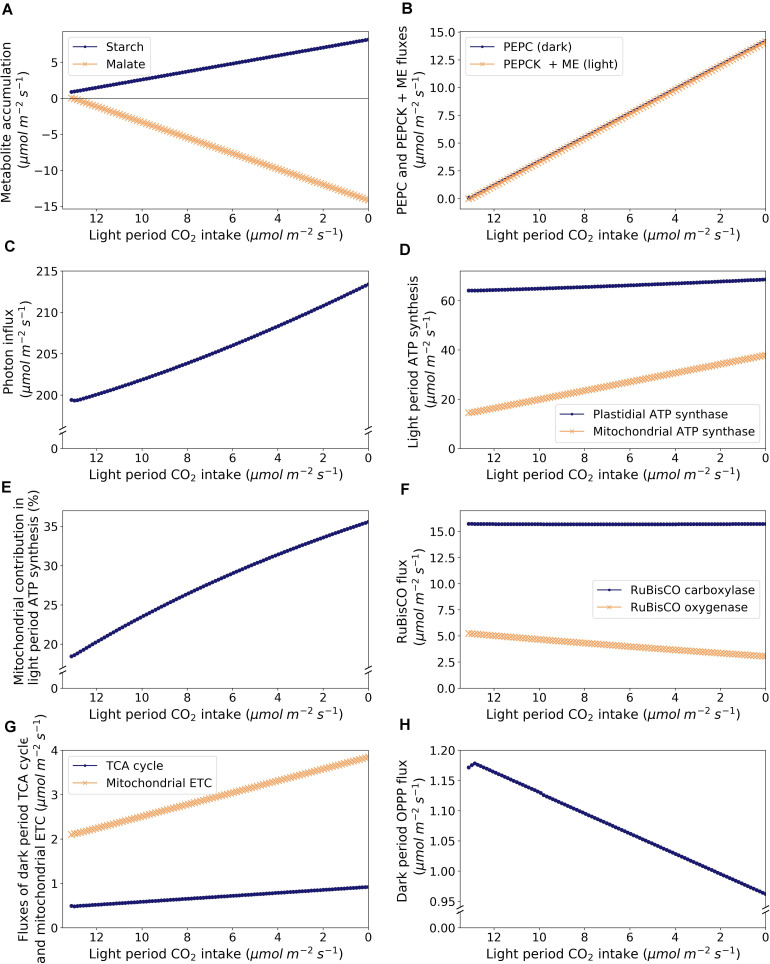
FIGURE 3.
Model predictions of metabolic changes along the C3-CAM continuum, as modeled by varying CO2 exchange during the light period. (A) Accumulation of starch (dots) and malate (crosses), (B) Dark period PEPC flux in the dark period (dots) and malate carboxylation flux as the sum of fluxes of PEPCK and malic enzyme in the light period (crosses), (C) Photon intake in the light period, (D) ATP synthesis in the light period by plastidial ATP synthase (dots) and mitochondrial ATP synthase (crosses), (E) Proportion of light period ATP synthesis by the mitochondrial ATP synthase, (F) Fluxes of RuBisCO carboxylase (dots) and oxygenase (crosses), (G) Fluxes through the TCA cycle (taken as the flux of succinate dehydrogenase; dots) and the mitochondrial ETC (taken as the flux of NADH dehydrogenase; crosses) in the dark period, and (H) flux through the OPPP (taken as the sum of fluxes of plastidial and cytosolic glucose 6-phosphate dehydrogenases) in the dark period.

