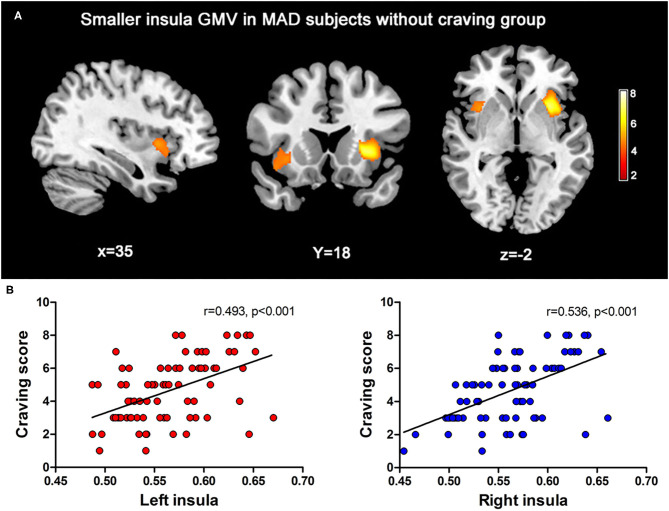
Figure 1.
(A) The maps for the MADs without craving had extensive significantly decreased in IC GMV (FWE correction, p < 0.05) than the MADs with craving. (B) The scatter plot of the correlation obtained between regions of interesting of IC GMV with the craving scores reported by the MADs at the first MRI scan.

