Figure 2.

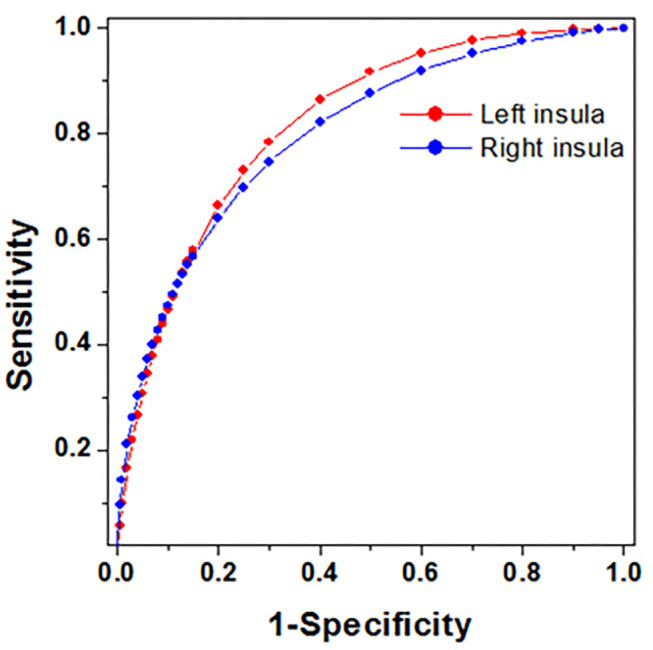
The plots of ROC curves obtained from whole model group MADs. All the sensitivity and specificity were calculated based on Youden index cut-off point.

The plots of ROC curves obtained from whole model group MADs. All the sensitivity and specificity were calculated based on Youden index cut-off point.