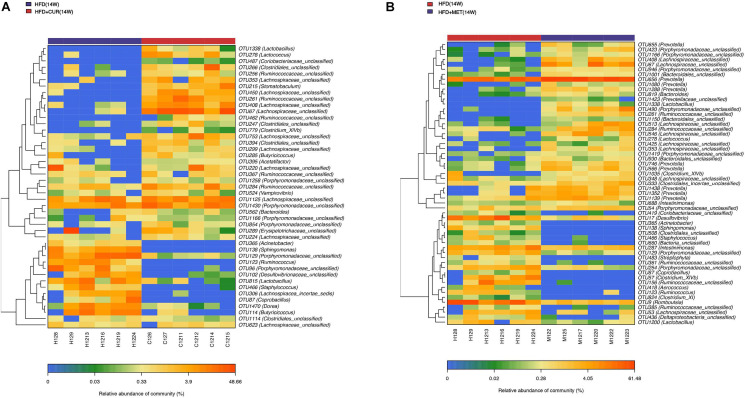
FIGURE 10.
Responses of the structure of the gut microbiota to CUR and MET treatment. (A) The changing direction of the OTUs by CUR. (B) The changing direction of the OTUs by MET. Red and blue colors indicate the abundance of OTUs that were more and less abundant, respectively, in HFD + CUR (14W) group and HFD + MET (14W) group relative to HFD (14W) group.

