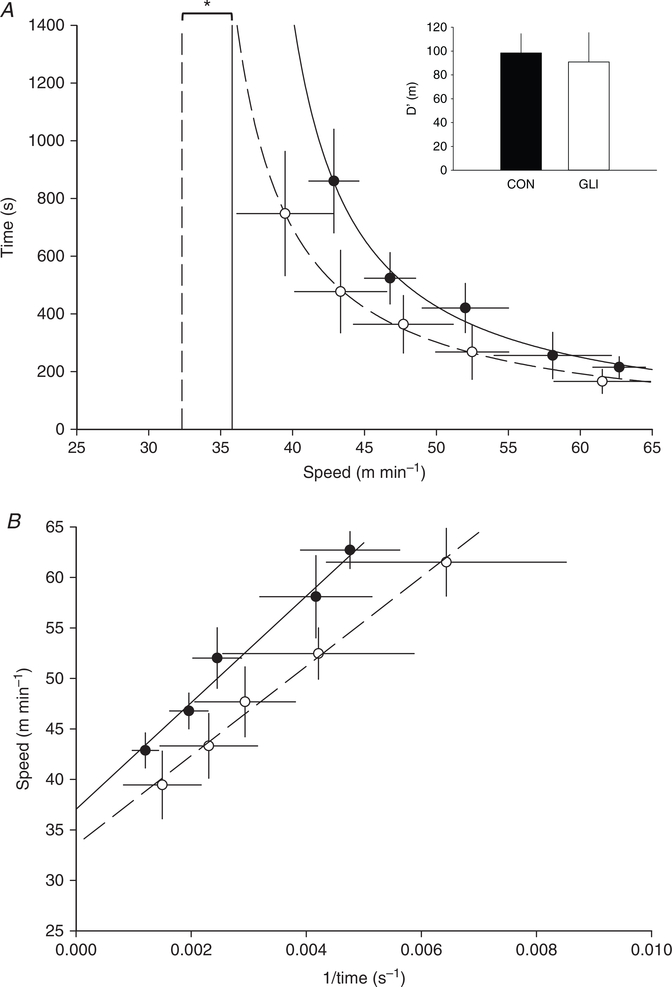
Figure 2. Speed–duration relationship following systemic KATP channel inhibition.
The hyperbolic (A) and 1/time linear (B) speed–duration relationships are modelled under control (closed circle, continuous line) and systemic KATP channel inhibition (GLI; open circle, dashed line) conditions to determine critical speed (vertical lines (A) and y-intercept (B)) and D′ (inset). These mean data fits are for illustrative purposes only, with individually determined critical speed and D′ and subsequent group means presented in Table 2. Data are means ± SD and compared via two-tail paired t tests.
*P < 0.05 vs. control.

