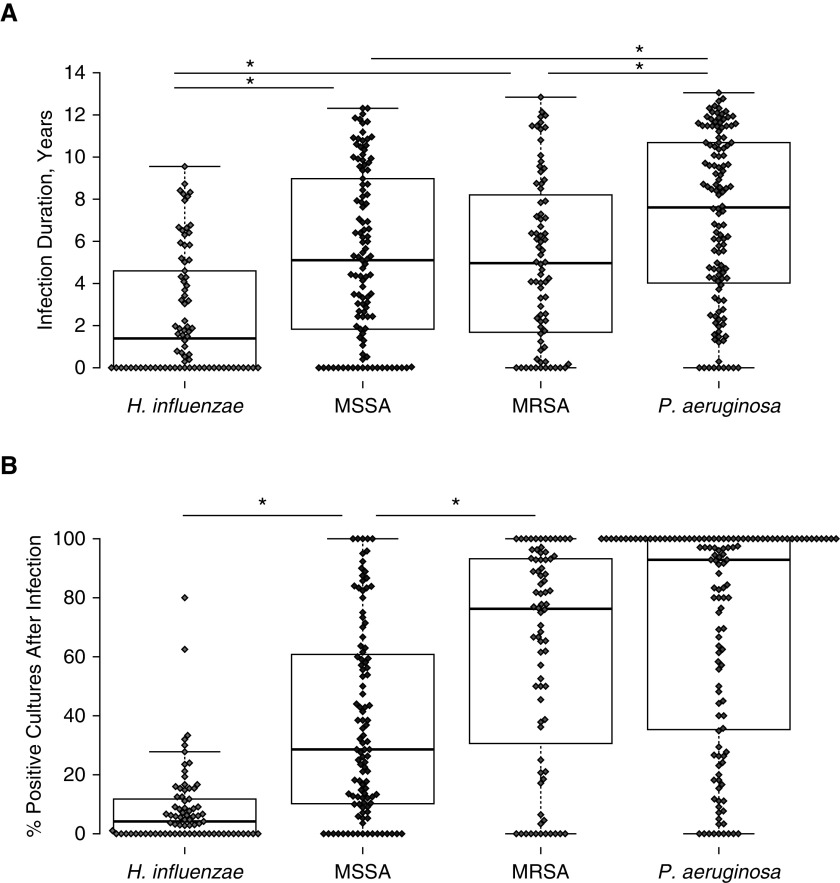
Figure 3.
(A) Duration of infections within individual patients between January 1, 2004, and December 31, 2017. Dots represent the time (in years) from the first positive culture to the last positive culture for the organisms listed at bottom. N = 134 subjects; 78 Haemophilus influenzae, 109 methicillin-sensitive Staphylococcus aureus (MSSA), 76 methicillin-resistant Staphylococcus aureus (MRSA), 124 Pseudomonas aeruginosa. (B) Persistence of bacterial species after initial positive infection. Dots represent percentage of cultures that are positive for the organism listed after the first positive culture. Dots are not displayed if the subject’s only positive culture for an organism was the final culture. N = 134 subjects; 77 H. influenzae, 107 MSSA, 76 MRSA, 124 P. aeruginosa. *P < 0.05 by Wilcoxon signed-rank test.

