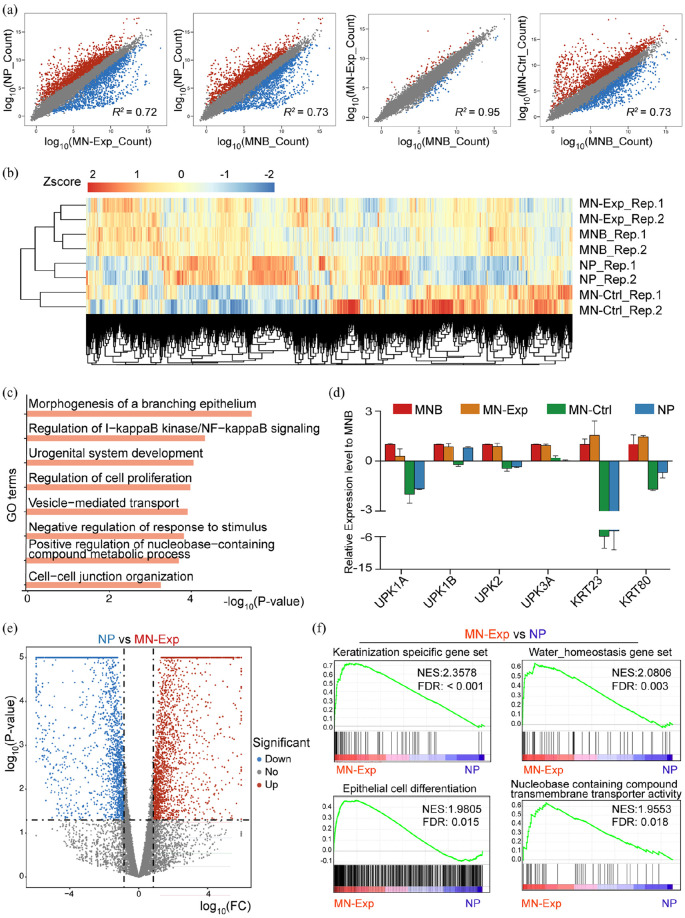
Figure 6.
Global gene expression profiles of MN-Exp, MNB, NP, MN-Ctrl: (a) pairwise scatter plot analysis of the global gene expression profiles of MN-Exp, MNB, NP, MN-Ctrl cells. The transcriptome of each cell type was profiled by RNA-seq analysis. Gene reads count levels are depicted in log10 scale. Pearson’s correlation coefficients (r) are indicated, (b) heat map of the z-transformed gene expression values in MN-Exp, MNB, NP, MN-Ctrl. MN-Exp, MNB cells are classified into the same hierarchical cluster, (c) GO enrichment of genes highly expressed in both MNB and MN-Exp compared to MN-Ctrl and NP, (d) expression of MNB cell marker genes UPK family and KRT family genes. Data are presented as mean ± SD (n = 2), (e) volcano plot (significance vs. fold change) of significantly altered genes (fold change ⩾2 and p-value < 0.05) between NP and MN-Exp cells, and (f) Gene Set Enrichment Analysis (GSEA) showed significant enrichment of epithelial related gene sets, water homeostasis and nucleobase containing compounds transporter activity in MN-Exp compared to NP. The normalized enrichment scores (NES) and tests of statistical significance (FDR) are shown.

