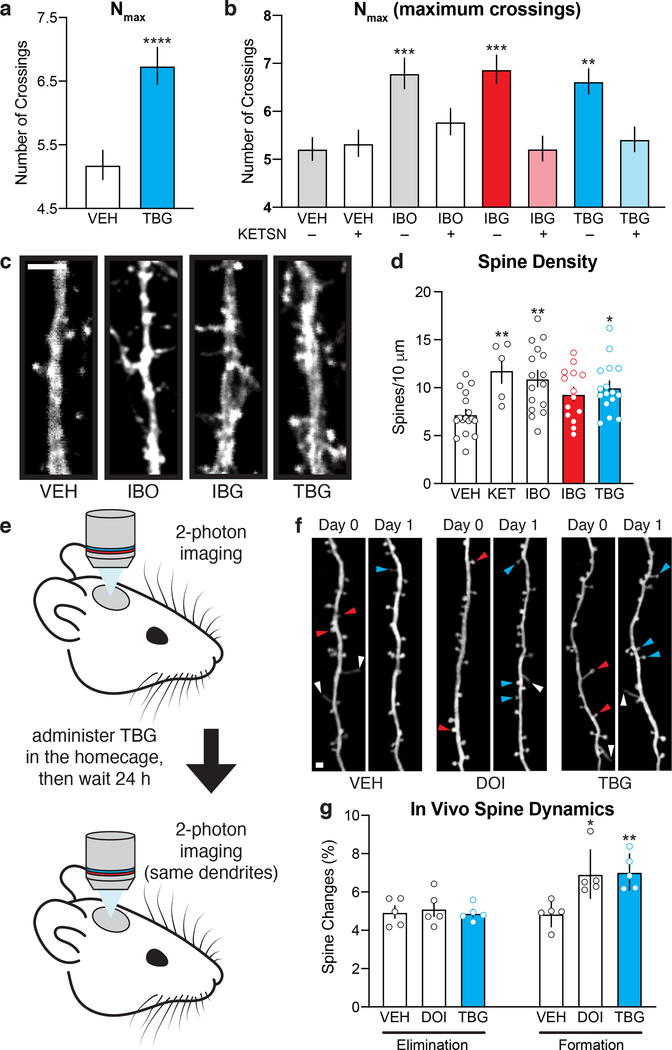
Figure 3. TBG promotes neural plasticity.
(a) Maximum numbers of crossings (Nmax) of Sholl plots obtained from rat embryonic cortical neurons (DIV6). (b) The effects of TBG on dendritic growth are blocked by the 5-HT2A antagonist ketanserin. (c) Representative images of secondary branches of rat embryonic cortical neurons (DIV20) after treatment with ibogalogs for 24 h. Scale bar = 2 μm. (d) TBG increases dendritic spine density on rat embryonic cortical neurons (DIV20) after treatment for 24 h. (e) Schematic illustrating the design of transcranial 2-photon imaging experiments. (f) Representative images of the same dendritic segments from mouse primary sensory cortex before (Day 0) and after (Day 1) treatment. Blue, red, and white arrowheads represent newly formed spines, eliminated spines, and filopodia, respectively. Scale bar = 2 μm. (g) DOI and TBG increase spine formation but have no effect on spine elimination. Exact N numbers for each experimental condition are reported in the Source Data and Supplementary Table 1. Specific statistical tests, information on reproducibility, and exact p values are reported in the Methods and Supplementary Table 1.

