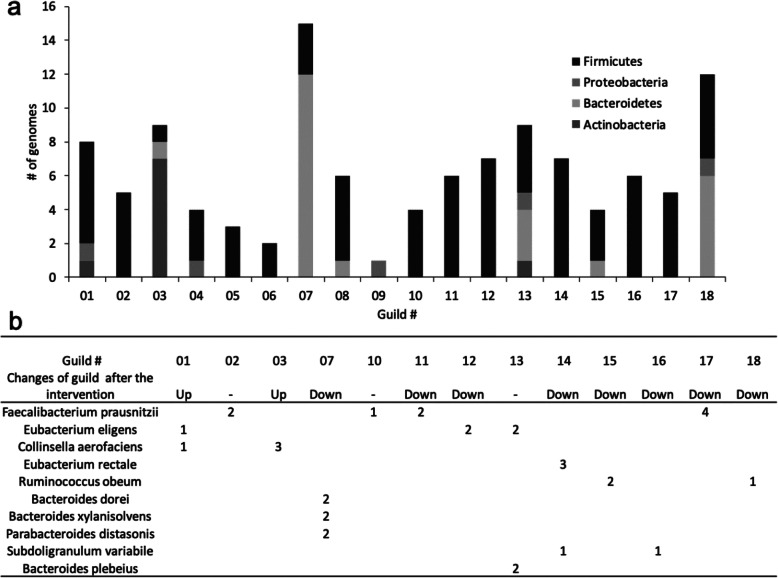
Fig. 2.
The taxonomic heterogeneity of guilds identified in the PWS study. a This stacked bar plot shows the phylum assignment of genomes belonging to each guild. b This table presents the distribution of species across guilds. The numbers in the table represent the number of genomes belonging to each species found in each guild. For example, 5 different genomes of the Eubacterium eligens species were found in guild#1, guild#12, and guild#13. A blank entry means that no genome from this species was found in this guild. “Up” denotes the guilds increased after the intervention, while “Down” indicates the guilds decreased after the intervention

