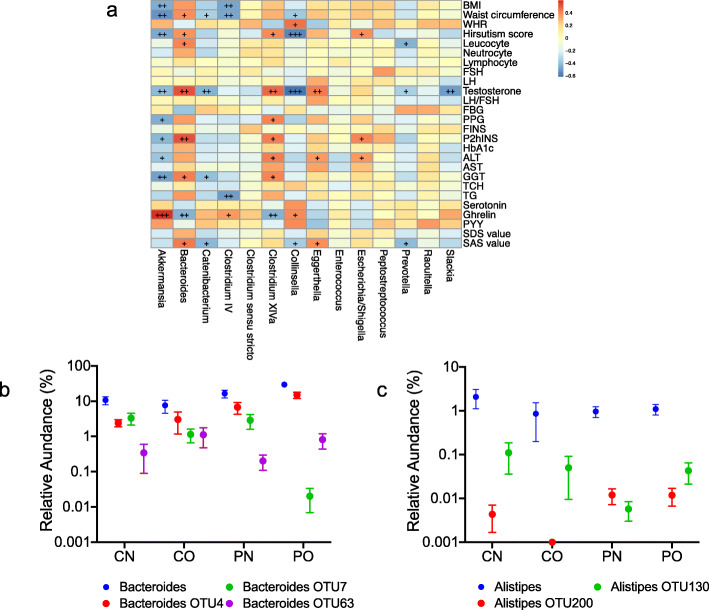
Fig. 4.
Comparing taxon-based and guild-based analysis in the PCOS study. a shows that the correlations between clinical parameters and prevalent genera are significantly different among PCOS patients and non-obese controls. The color of spots represents R value of the Spearman correlation between each genus and clinical parameter (+FDR < 0.05, ++FDR < 0.01, +++FDR < 0.001). b and c show the different abundance distributions of Bacteroides genus and 3 Bacteroides OTUs or Alistipes genus and 2 Alistipes OTUs in different patient groups. Bacteroides OTU4 belonged to a guild that was positively correlated with disease phenotype, while Bacteroides OTU7 and Bacteroides OTU63 belonged to a negatively correlated guild. Alistipes OTU200 belonged to a guild that was positively correlated with disease phenotype, and Alistipes OTU130 belonged to a guild that was negatively correlated with disease phenotype. a For leucocyte, neutrocyte, lymphocyte, and hirsutism, n = 46; for the other parameters, n = 48. BMI, body mass index; WHR, waist hip ratio; FSH, follicular stimulating hormone; LH, luteinizing hormone; FPG, fasting plasma glucose; PPG, 2 h postprandial plasma glucose; FINS, fasting plasma insulin; P2hINS, 2 h postprandial plasma insulin; HbA1c, hemoglobin A1c; ALT, alanine aminotransferase; AST, aspartate transaminase; GGT, γ-glutamyltransferase; TCH, total cholesterol; TG, triglyceride; PYY, peptide YY; SDS, self-rating depression scale; SAS, self-rating anxiety scale. b, c CN, non-obese control group (n = 9); CO, obese control group (n = 6); PN, non-obese PCOS group (n = 12); PO, obese PCOS group (n = 21)

