
Fig. 5.
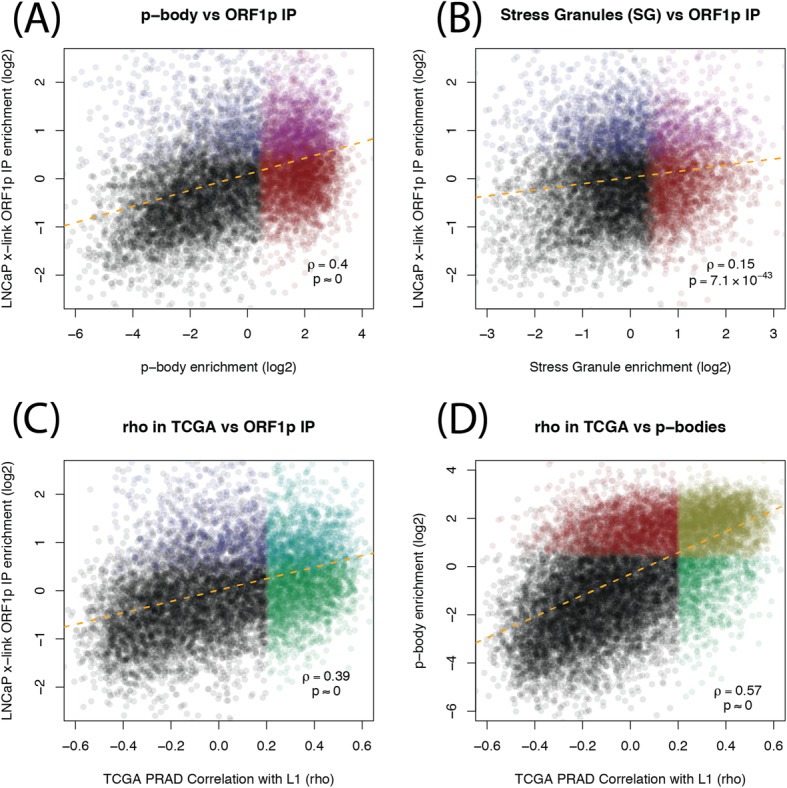
Scatter plots comparing ORF1p IP RNAs, granules RNAs and RNAs correlated with LINE-1 in TCGA prostate cancer. a For each gene, enrichment in p-body purification study [55] (x-axis) vs enrichment in our ORF1p IPs, calculated by DESeq2 (y-axis). b Same y-axis as in a, but using SG enrichments [54] on the x-axis. c RNA expression correlation between host genes and intact LINE-1 in TCGA prostate cancer samples (x-axis) vs enrichment in our ORF1p IPs (y-axis). d Same x-axis as in c, but y-axis is p-body enrichment (same as x-axis in a)