Fig. 2.
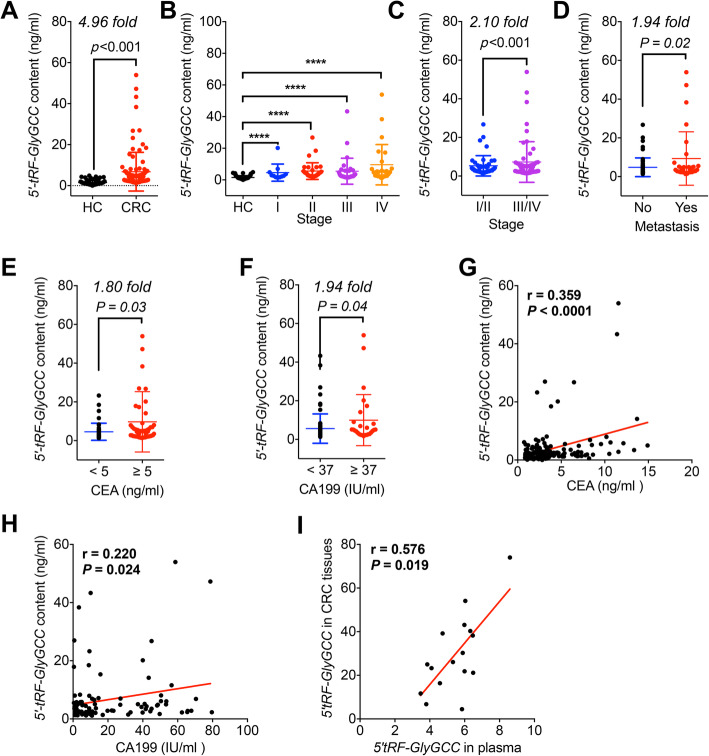
The levels of 5′-tRF-GlyGCC in plasma of CRC patients. a The amount and relative fold of 5′-tRF-GlyGCC in plasma of CRC patients (n = 105) and HC (n = 90). b The amount of 5′-tRF-GlyGCC in plasma of different pathological stages of CRC patients (stage I, n = 11; stage II, n = 34; stage III, n = 32; stage IV, n = 25). c The comparison of 5′-tRF-GlyGCC levels in plasma of stage I/II (n = 45) and III/IV (n = 57) CRC patients. d The comparison of 5′-tRF-GlyGCC levels in plasma of CRC patients with (n = 30) or without (n = 64) metastasis. e The comparison of 5′-tRF-GlyGCC levels in plasma of CRC patients with CEA ≥ 5 ng/ml (n = 54) or CEA < 5 ng/ml (n = 47). f The comparison of 5′-tRF-GlyGCC levels in plasma of CRC patients with CA199 ≥ 37 IU/ml (n = 27) or CA199 < 37 IU/ml (n = 74). g, h The Spearman correlation of 5′-tRF-GlyGCC amount with the levels of CEA (g) or CA199 (h) in CRC patients. i The Spearman correlation of 5′-tRF-GlyGCC amount in paired plasma and tumor tissues from 16 CRC patients. *p < 0.05, **p < 0.01, ***p < 0.001, ****p < 0.0001

