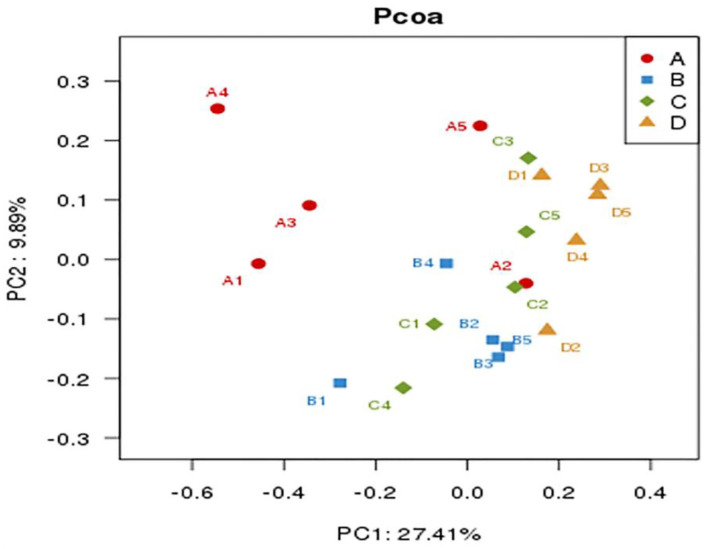
Figure 4.
Comparison of caecum microbiota compositions of weaned piglets by principal component analysis (PCoA) (n = 5). Group A (A1–A5): the control diet supplemented with 25 mg/kg quinocetone and 11.25 mg/kg chlortetracycline in the basal diet; Group B (B1–B5): 200 mg/kg bacteriophage diet; Group C (C1–C5): 400 mg/kg bacteriophage diet; Group D (D1–D5): 600 mg/kg bacteriophage diet. To determine the statistical differences in beta-diversity of bacterial communities among treatment groups, the PERMANOVA (Adonis procedure with 999 permutations) was performed to calculate P-values. There were significant difference between group A and group B (R2 = 0.191, P = 0.017), group A and group C (R2 = 0.234, P = 0.018), group A and group D (R2 = 0.227, P = 0.015), group B and group D (R2 = 0.155, P = 0.042), as well as group C and group D (R2 = 0.222, P = 0.017). No significant difference between group B and group C was found (R2 = 0.115, P = 0.454).

