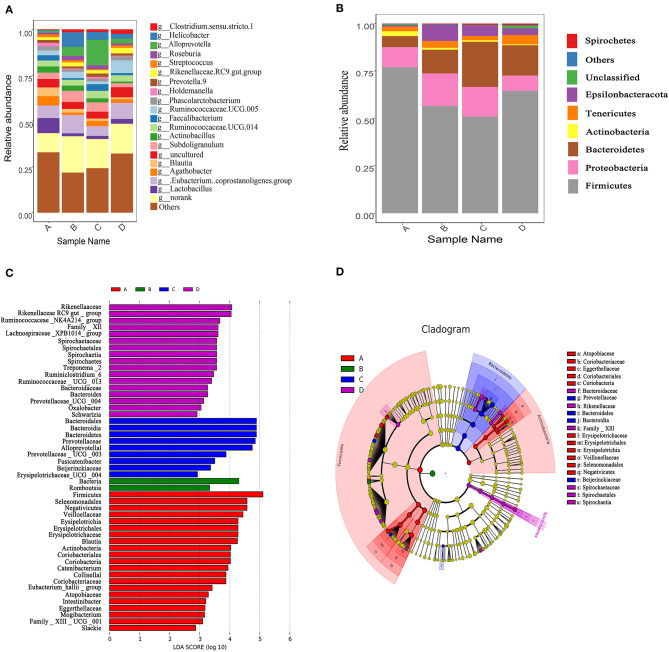
Figure 5.
Changes of caecum microbiota compositions of weaned piglets fed with or without dietary bacteriophage (n = 5). (A) The relative abundance of caecum microbiota composition at the phylum level. (B) The relative abundance of caecum microbiota composition at the genus level. (C) Cladogram and LDA value distribution histogram. Sample name A: the control diet supplemented with 25 mg/kg quinocetone and 11.25 mg/kg chlortetracycline in the basal diet; Sample name B: 200 mg/kg bacteriophage diet; Sample name C: 400 mg/kg bacteriophage diet; Sample name D: 600 mg/kg bacteriophage diet. The bacterial taxa were significantly differentiated between the bacteriophage group and the control group using linear discriminant analysis coupled with effect size (LEfSe) with the default parameters.

