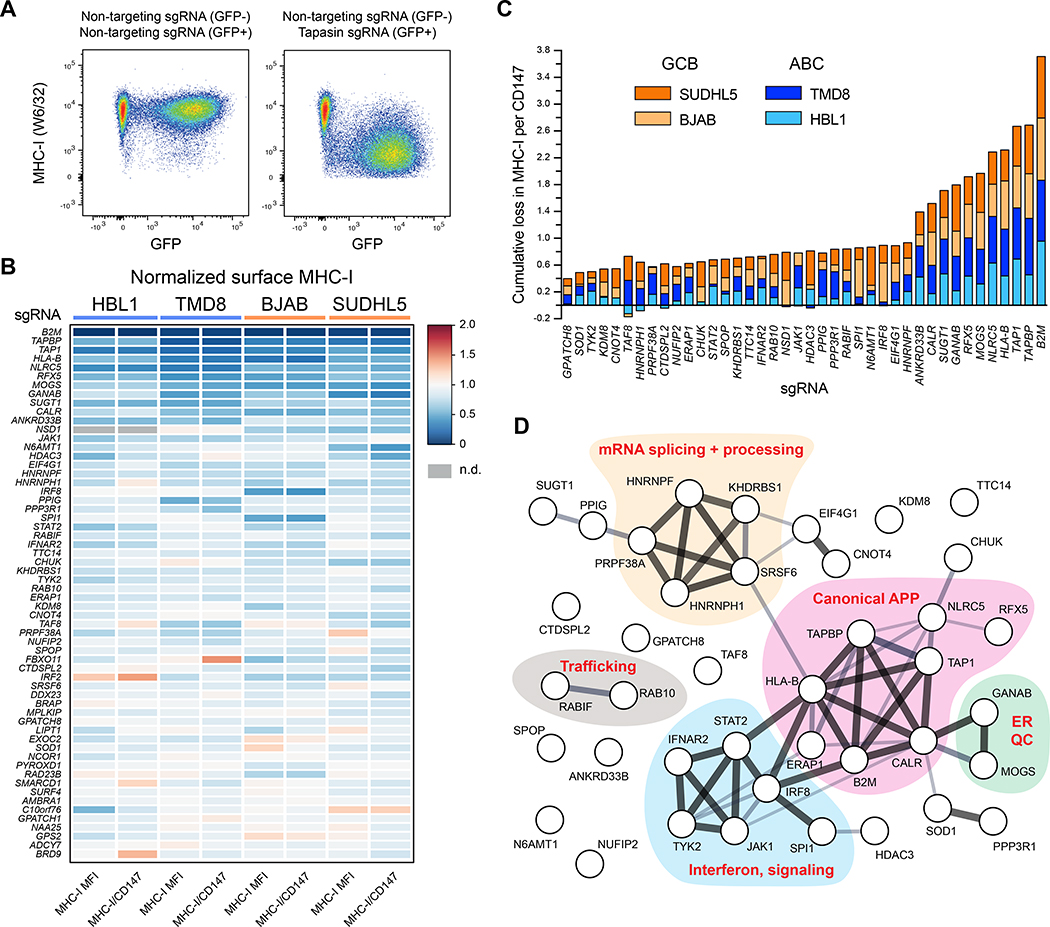
Figure 2. Validation of positive regulators of MHC-I.
(A) Example dot plots of how individual genetic ablations were tested for MHC-I effects. Cells were independently infected with lentiviruses encoding targeting or non-targeting sgRNAs in GFP+ or GFP− backbones. Post-selection, cells were mixed and analyzed together by flow cytometry. GFP− and GFP+ populations were used to quantify remaining surface MHC-I. (B) Validations of positive regulators of MHC-I. 60 of the top performing sgRNAs across four parental tumor lines are displayed as a heatmap of surface MHC-I expression relative to non-targeting sgRNAs. Also shown are quantifications of MHC-I per CD147, an unrelated surface protein. Note that not every previously known regulator was reanalyzed (e.g., TAP2, RFXAP). (C) Cumulative loss in MHC-I per CD147 upon the indicated genetic ablation across the four tumor lines. GCBs orange; ABCs blue. (D) STRING analysis of the validated positive regulators of MHC-I in DLBCL. See also Figure S1.

