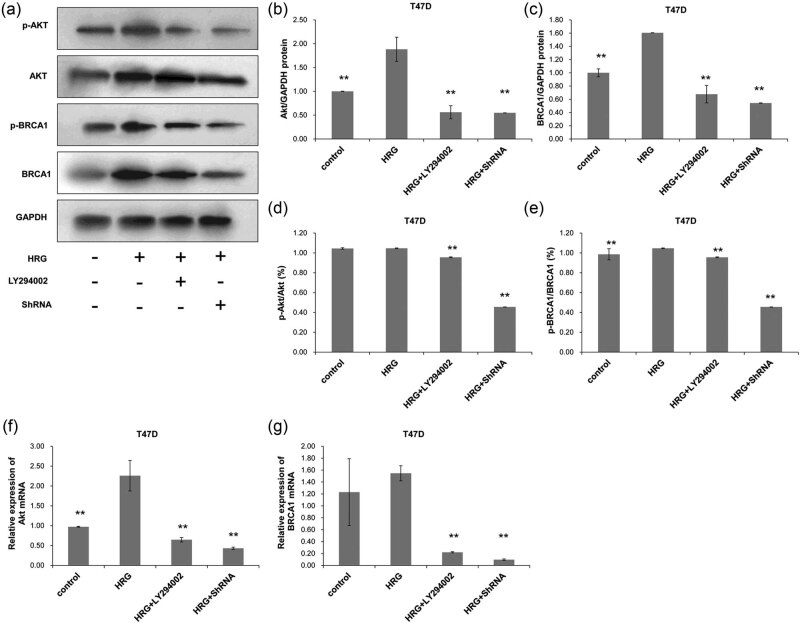
Figure 5.
The protein and mRNA expression of Akt and BRCA1 in T47D cells. Cell treatment and grouping were described above. The protein and mRNA expressions were detected with Western blot and RT-PCR, respectively. (a) The protein expressions of Akt and BRCA1 and their phosphorylated counterparts. The protein expressions of (b) Akt and (c) BRCA1 were quantified in relative to that of GAPDH. (d) The percentage of p-Akt in the total Akt protein. (e) The percentage of p-BRCA1 in the total BRCA1 protein. (f) The relative expression of Akt mRNA and (g) the relative expression of BRCA1 mRNA were also detected. All experiments were performed at least three times. *P < 0.05, compared with the control group; # P < 0.05, compared with the HRG group.

