Figure 1.
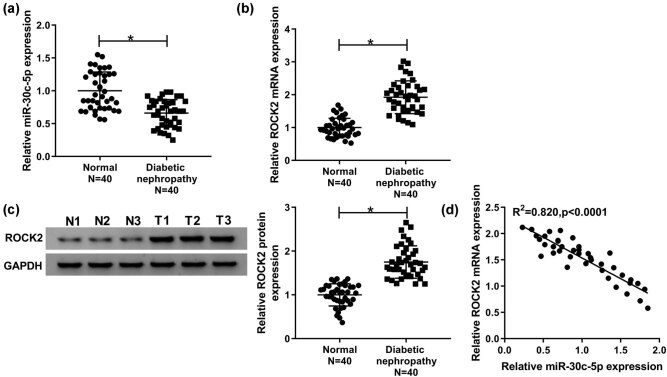
Level of miR-30c-5p was effectively decreased, whereas ROCK2 expression was significantly increased in DN tissues. (a and b) qRT-PCR was carried out to analyze the miR-30c-5p level and the mRNA level of ROCK2 in DN tissues compared with the paired control. (c) Protein expression of ROCK2 was measured by a western blot assay. (d) Spearman’s correlation analysis showed an inverse correlation between miR-30c-5p and ROCK2 mRNA levels. *P < 0.05.

