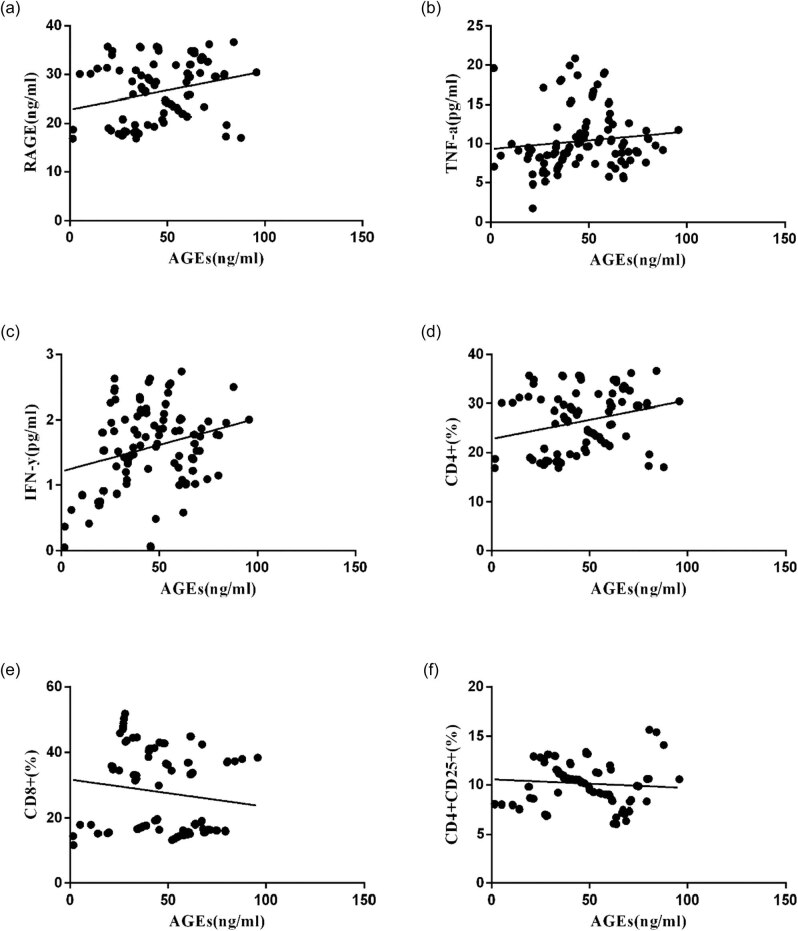
Figure 4.
Scatter plots of linear correlation between peripheral blood AGE level and other clinical indicators. Pearson’s correlation coefficient analysis was used to calculate the correlation between peripheral blood AGEs level and RAGE (a), TNF-α (b), IFN-γ (c), CD4+ (d), CD8+ (e), and CD4+ CD25+ (f).

