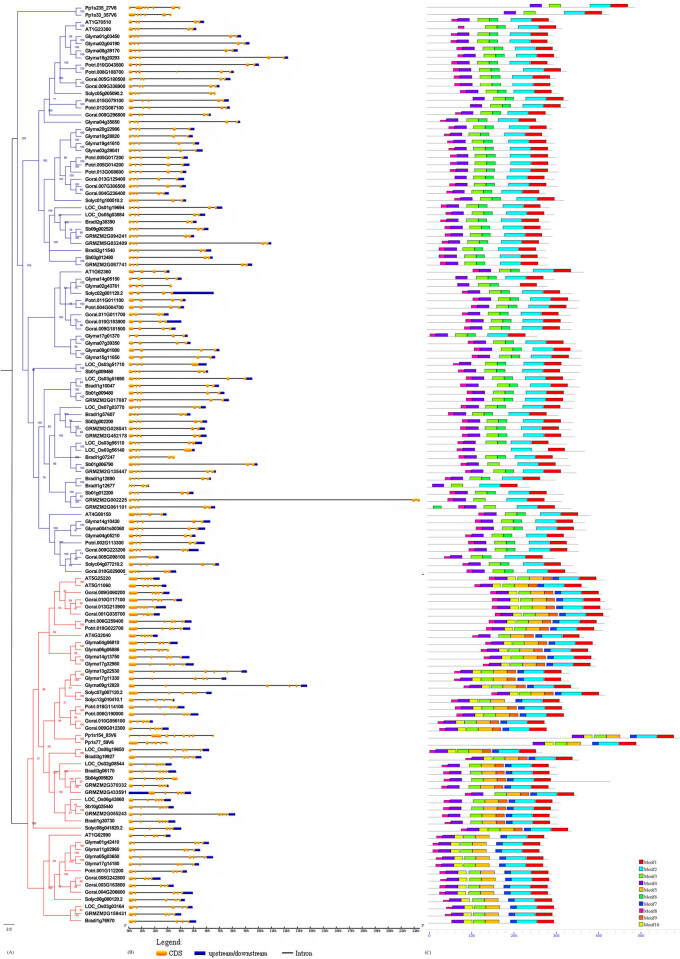
Figure 1.
Phylogenetic relationship, exon–intron structure, and motif structure of plant KNOX gene family members. (a) The rooted Bayesian phylogenetic tree. The branches of the two different colors represent different subfamilies: blue represents the class I KNOX gene and red represents the class II KNOX gene. (b) Exon and intron structure of KNOX genes. Yellow boxes, exons; lines, introns. The lengths of boxes and lines are scaled according to gene length. (c) MEME motif structures. Numbers and different colors were used to represent conservative motifs.

