
Figure 5.
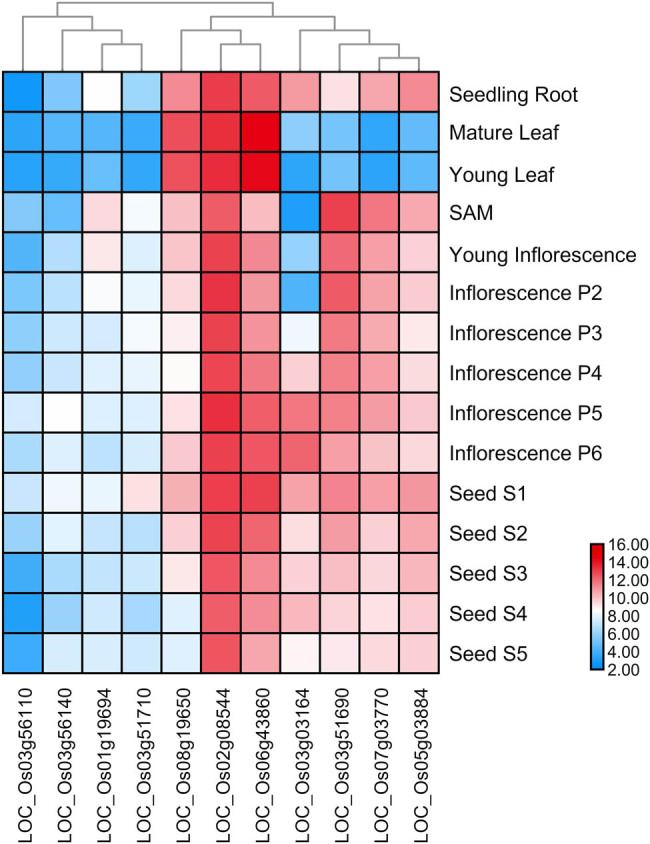
Expression profiles of rice KNOX genes. The expression level is represented by a color: dark red indicates the highest expression level, and dark blue indicates the lowest expression level. Other colors indicate medium levels of expression.