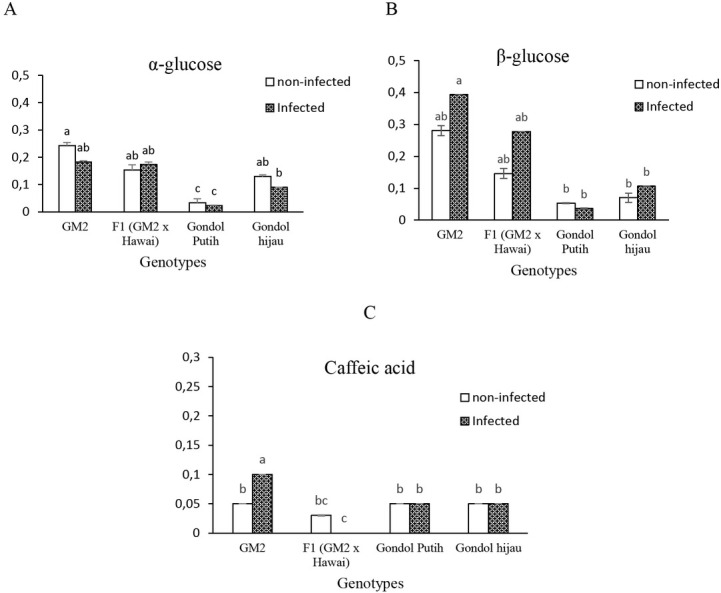
Figure 5.

Concentration of α- glucose (A), β-glucose (B), and caffeic acid (C) for the resistant and susceptible tomato plants. Bars with the same letter are not significantly different at 5% level according to Tukey’s HSD test.

Concentration of α- glucose (A), β-glucose (B), and caffeic acid (C) for the resistant and susceptible tomato plants. Bars with the same letter are not significantly different at 5% level according to Tukey’s HSD test.