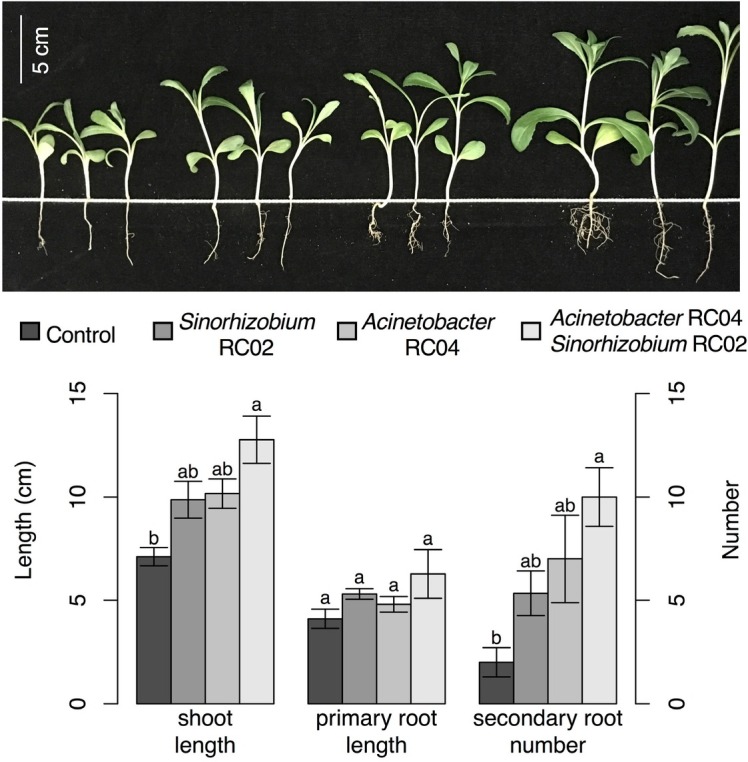
Figure 4.

Growth promotion of safflower seedlings by PSB. Bars represent the mean, and error bars show the standard error (n = 3). Means within each group marked with different lowercase letters were significantly different (TukeyHSD, P < 0.01).

Growth promotion of safflower seedlings by PSB. Bars represent the mean, and error bars show the standard error (n = 3). Means within each group marked with different lowercase letters were significantly different (TukeyHSD, P < 0.01).