Figure 1.

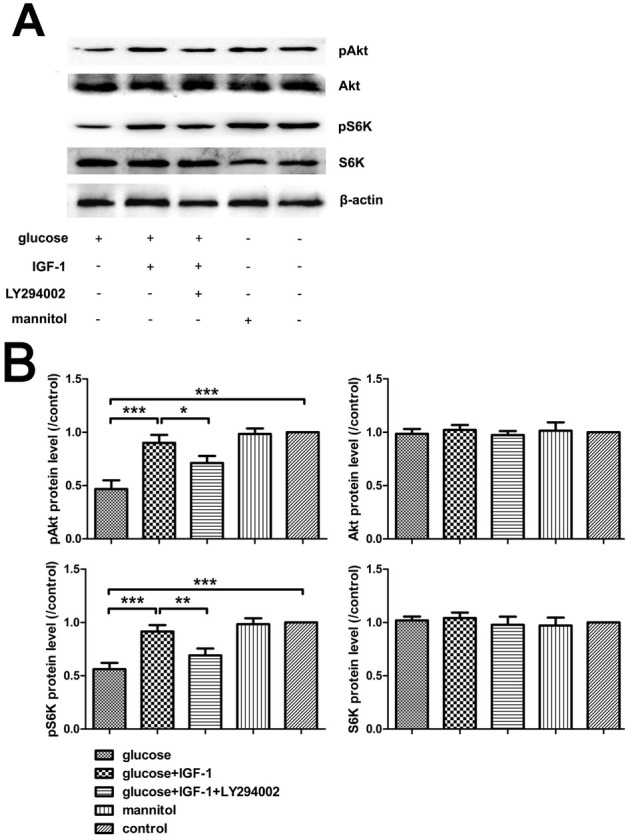
Phosphorylation of Akt and S6K analysis with Western blot. (A) Immunoreactive bands. (B) Analysis for pAkt, Akt, pS6K, and S6K protein levels. Mean ± SD (n = 5). *P<0.05, **P<0.01, ***P<0.001.

Phosphorylation of Akt and S6K analysis with Western blot. (A) Immunoreactive bands. (B) Analysis for pAkt, Akt, pS6K, and S6K protein levels. Mean ± SD (n = 5). *P<0.05, **P<0.01, ***P<0.001.