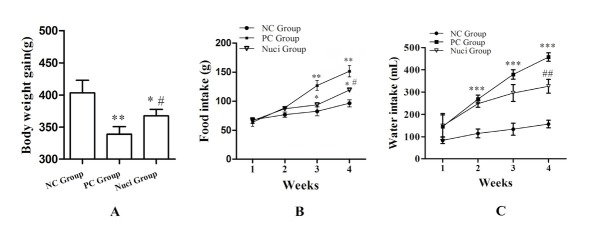
Figure 1.
Body weight, food intake, and water intake. A, the body weight of rats; B, the food intake; C, the water intake. Data are presented as themeans ± SEM of determinations (n =15), indicates statistically significant differences when compared with NC group, * P<0.05 and ** P<0.01; indicates statistically significant differences when compared with PC group, # P<0.05 and ## P<0.01.NC was a control group and the rats were allowed to free access to a normal diet; PC was a diabetic control group; Nuci was a treated group and the diabetic animals were treated with nuciferine 200 mg/kg/day, below the abbreviation of the same.

