Fig. 2.

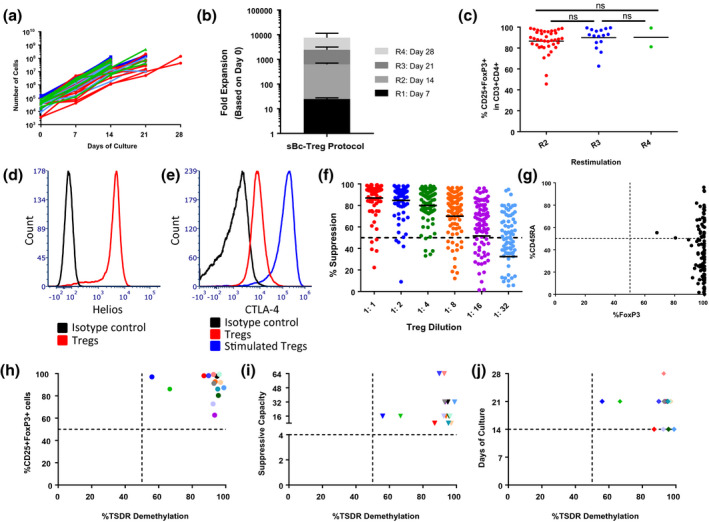
Expansion of cynomolgus macaque (MCM) regulatory T cells (Tregs) with CD40L‐sBc. Expansion of MCM Tregs with CD40L‐sBc stimulation. (a) Treg numbers at each restimulation and take‐down (n = 57). (b) Mean and standard error of the mean (s.e.m.) of the fold expansion of the Treg lines at each restimulation until the take‐down. ‘R’ represents restimulation number. (c) Percentage of CD25+FoxP3+ cells within CD3+CD4+ cells at the take‐down. (d) Representative Helios expression on cultured Tregs (red) (n = 5). (e) Representative cytotoxic T lymphocyte antigen‐4 (CTLA‐4) expression on cultured Tregs (red) and cultured Tregs activated with phorbol myristate acetate (PMA)/ionomycin for 4 h (blue) (n = 5). (f) Percentage of suppressive capacity of the Treg lines (n = 57). The dotted line represents 50% suppression as reference. Mean of the suppressive capacity is represented with a black line for each ratio of Treg : peripheral blood mononuclear cells (PBMCs). (g) Correlation between CD45RA and forkhead box protein 3 (FoxP3) expression. Correlation between the percentage of Treg‐specific demethylated region (TSDR) demethylation and the (h) expression of FoxP3, (i) suppressive capacity (the Treg : responder ratio that achieves 50% suppression of the positive control) and (j) days of culture. Each color represents a different Treg line that is the same throughout Fig. 2h–j (n = 15).
