Fig. 3.

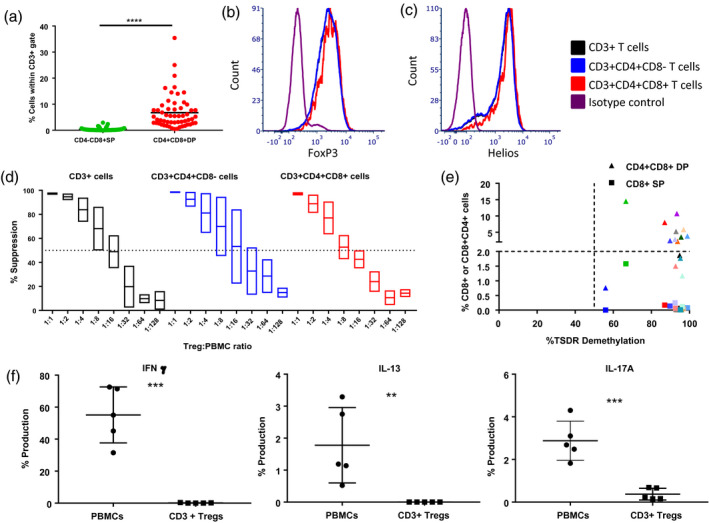
Forkhead box protein 3 (FoxP3) expression and suppressive capacity of CD4+CD8+ DP T cells. (a) Comparison between the percentage of CD3+CD4‐CD8+ SP and CD3+CD4+CD8+ double‐positive (DP) T cells present in the regulatory T cell (Treg) cultures at the harvest time‐point (days 14, 21 or 28) (n = 57). Study of the (b) FoxP3, (c) Helios expression and (d) suppressive capacity [mean and standard error of the mean (s.e.m.)] of total CD3+ T cells (black), CD3+CD4+CD8− SP T cells (blue) and CD3+CD4+CD8+ DP T cells (red) (n = 2). (e) Correlation between the percentage of Treg‐specific demethylated region (TSDR) demethylation in total CD3+ cells and the percentage of CD8+ single‐positive (SP) and CD4+CD8+ (DP) T cells present in culture. Each color represents a different Treg line (n = 15). (f) Assessment of the secretion of interferon (IFN)‐γ, interleukin (IL)‐13 and IL‐17A in peripheral blood mononuclear cells (PBMCs) and cultured sBc‐Tregs (n = 5).
