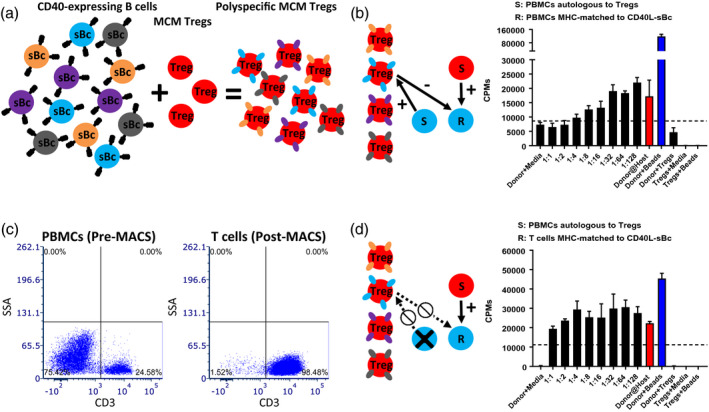
Fig. 4.

Difference in suppression based on the responder‐type cells. (a) Schema for the expansion protocol of cynomolgus macaque (MCM) regulatory T cells (Tregs) with CD40L‐sBc. (b) Representative figure of a specificity assay with peripheral blood mononuclear cells (PBMCs) as responders. (c) Representative figure of before (left panel) and after (right panel) magnetic‐activated cell sorted (MACS)‐isolated T cells. (d) Representative figure of a specificity assay with MACS‐isolated T cells as responders.
