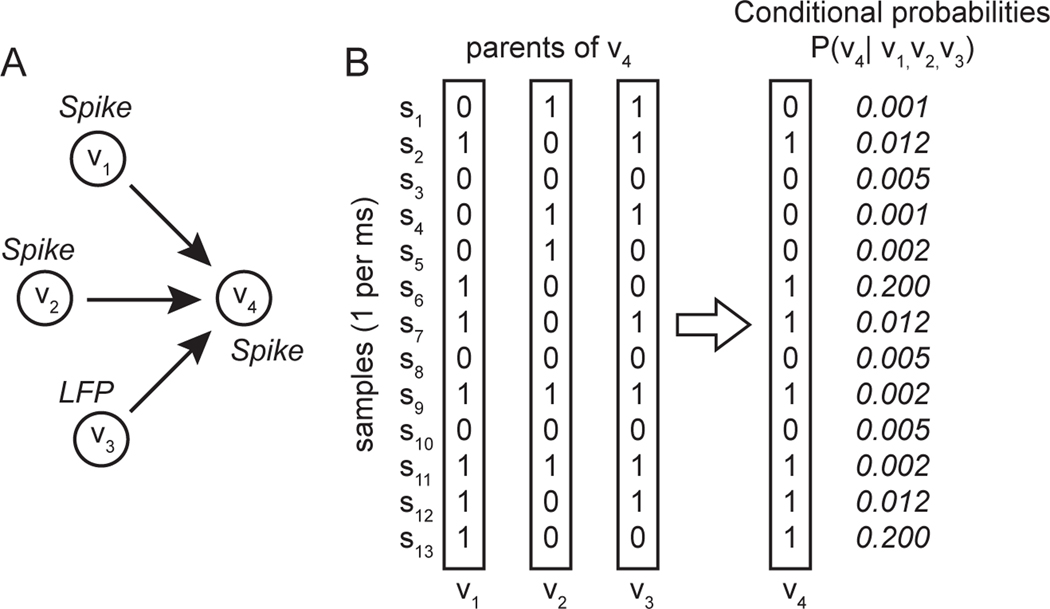
Figure 2. Conceptual schematic illustrating application of causal discovery analysis to neural time series data.
A. Graph showing directed edges from three parent nodes V1, V2, V3, (two spiking neuron and one LFP power) to a child node, V4 (spiking neuron). B. Sequence of activity states (samples) each represented as a 0 or a 1 at each time step, in the three parent nodes and the one child node, along with the conditional probabilities associated with each combination of states at each time step. FGES finds the pattern of edges that maximizes the product of the conditional probabilities over all samples and nodes in the network, while minimizing the number of edges.

