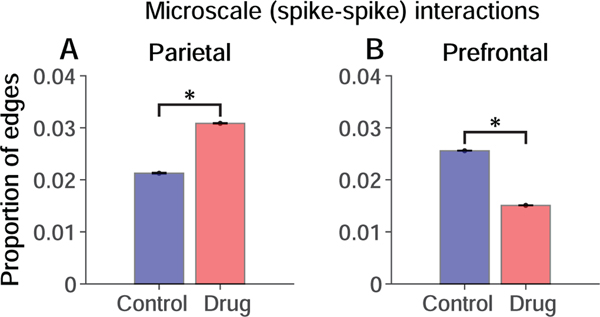
Figure 4. Influence of NMDAR blockade on microscale interactions.
Permutation-corrected proportion of significant interactions between neurons relative to the total number of possible interactions given the numbers of neurons recorded. Significant differences are indicated by * (p < 0.01; permutation test). Blue, Control condition. Red, Drug condition. A. Parietal neurons. B. Prefrontal neurons. Error bars represent the standard deviation of the permutation distributions.

