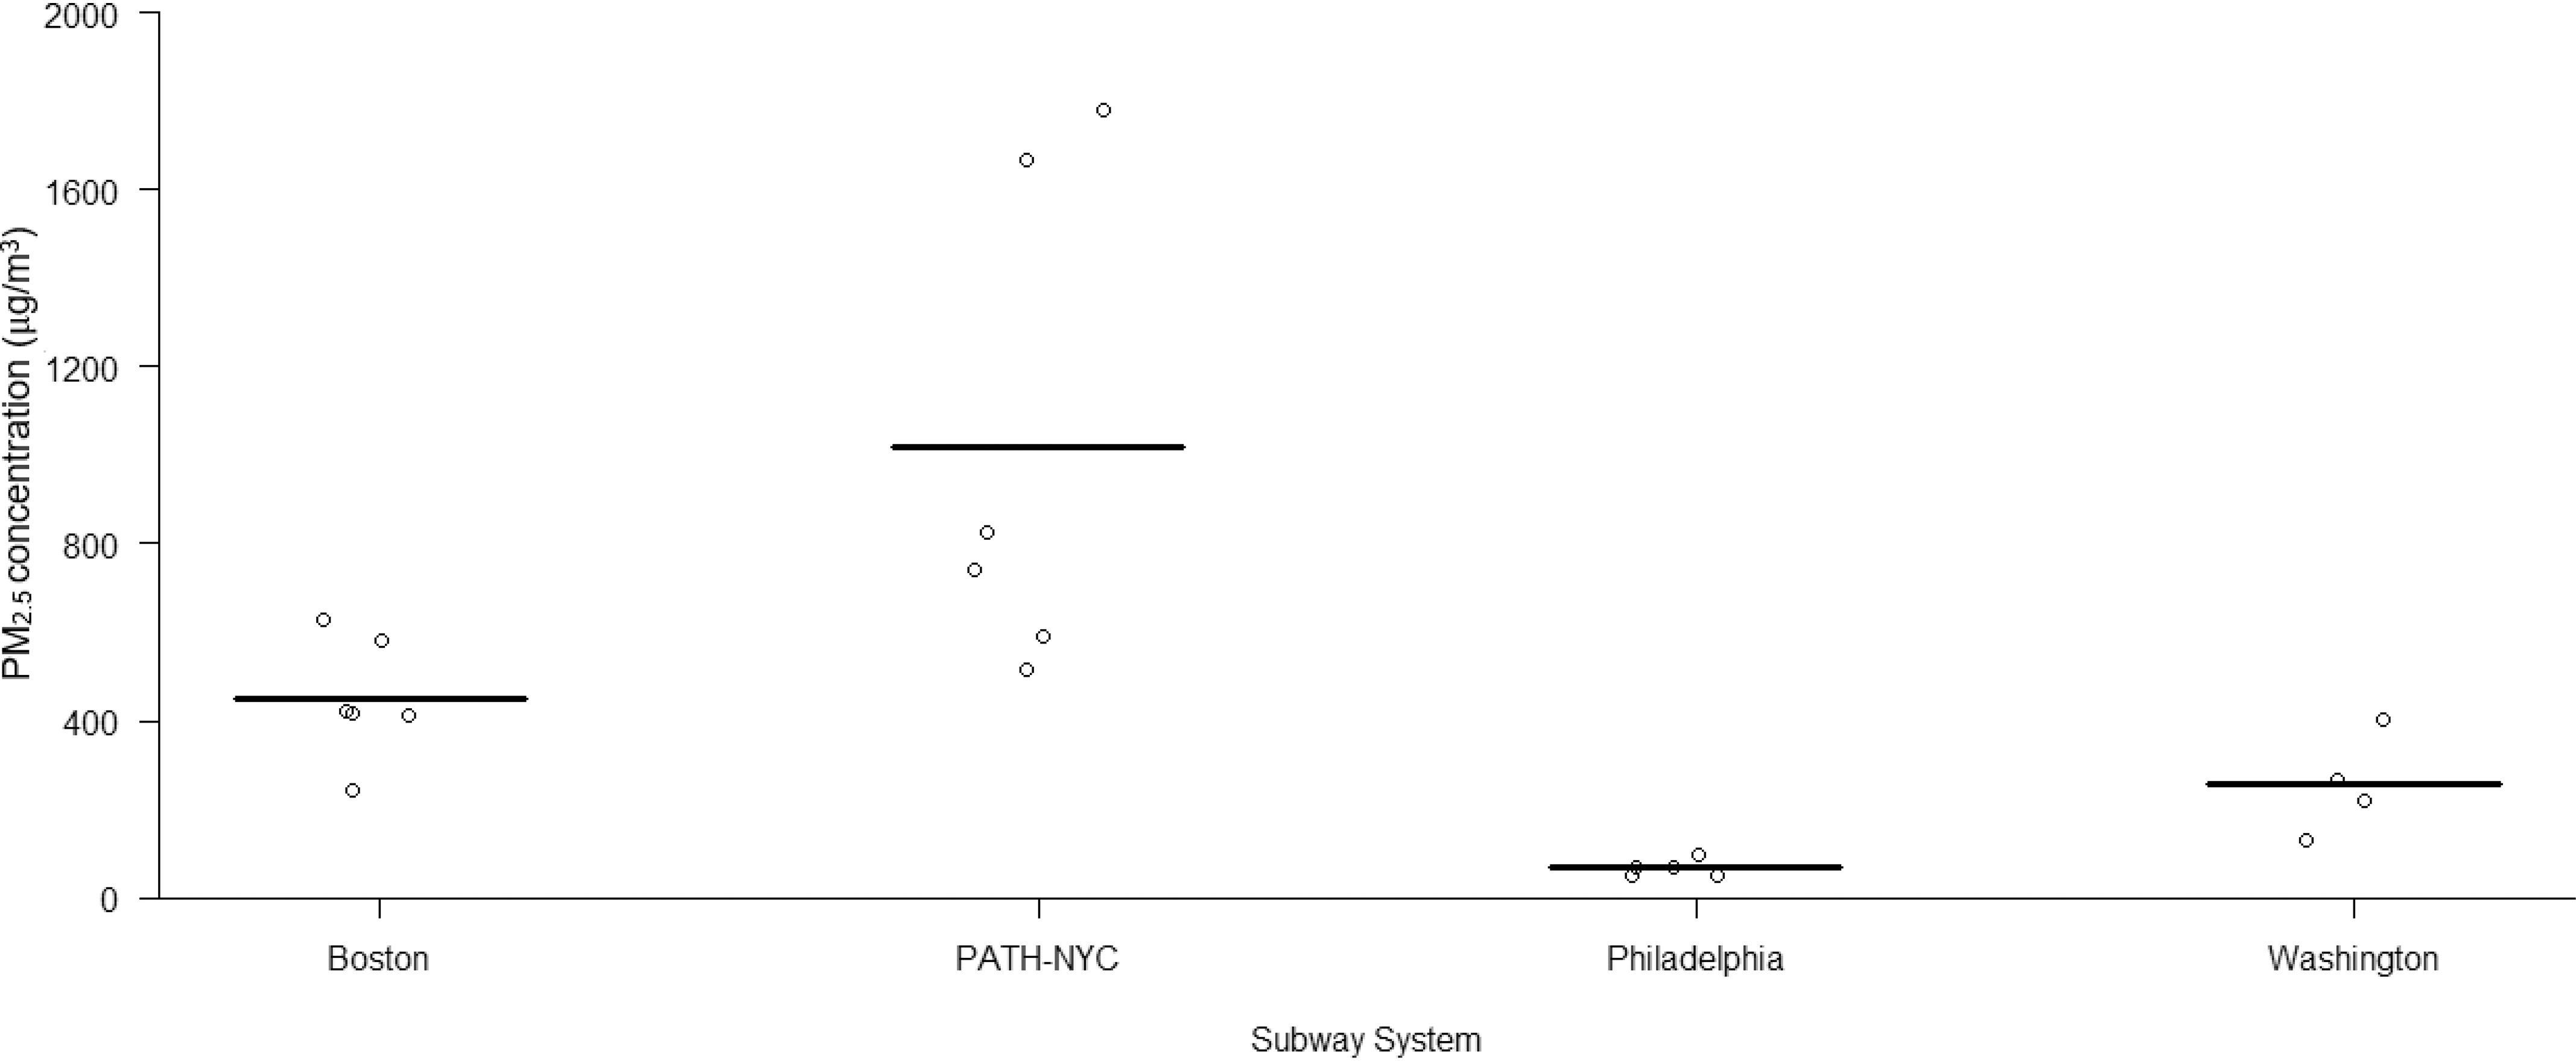
Figure 1.

Mean (horizontal lines) gravimetric-based concentrations on underground subway platforms in four urban transit systems. The open circles represent the individual measurements. Stations represented in the Boston transit system: Broadway (), Government Center–Blue Line (), and Tufts Medical Center (); in the PATH-NYC/NJ transit system: Newport () and Christopher Street (); in the Philadelphia transit system: Race/Vine (), City Hall (), 13th Street (), 15th Street (), and 30th Street (); and in the Washington, DC, transit system: Van Ness () and Capitol South (). Filtered-based was collected for 30 to 60 min at .
