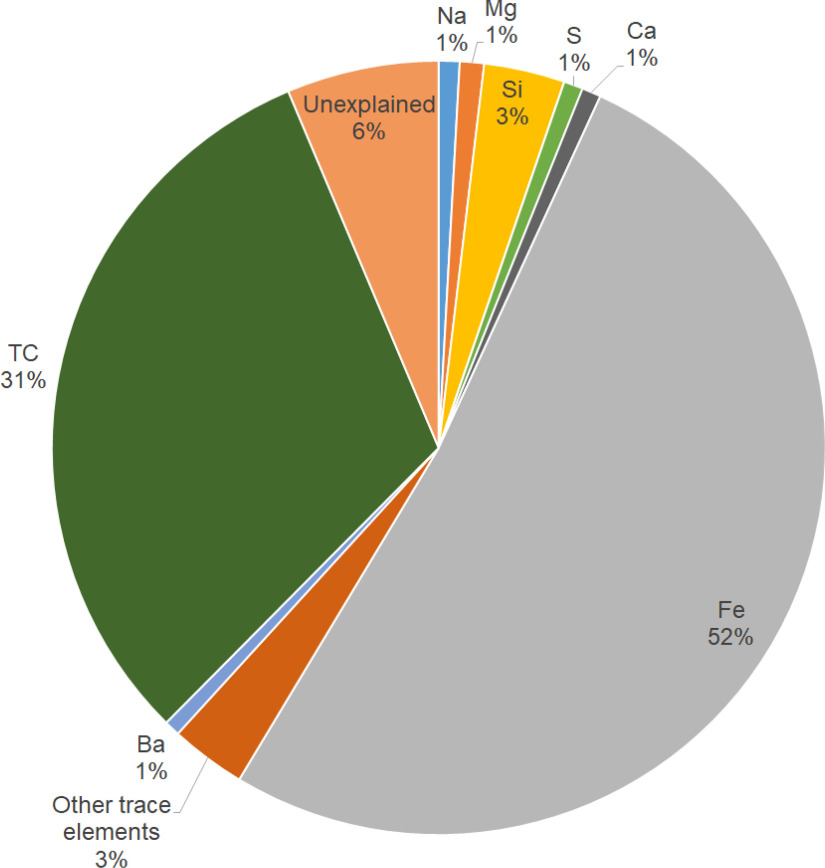
Figure 2.
Average percent contribution of elemental constituents to total mass of collected on filters in underground stations in three urban transit systems. Each system is represented by the two stations with the highest measured concentrations: Government Center–Blue Line () and Broadway in Boston; Christopher Street () and Newport () in the PATH-NYC/NJ system; and Van Ness () and Capitol South () in Washington, DC. Trace elements analysis was conducted with XRF analysis of Teflon filters and carbon analysis was performed on the quartz filters using NIOSH’s 5,040 method (NIOSH 2003). Note: Ba, Barium; Ca, Calcium; Fe, Iron; Mg, Magnesium; Na, Sodium; S, Sulfur; Si, Silicon; TC, total carbon.

