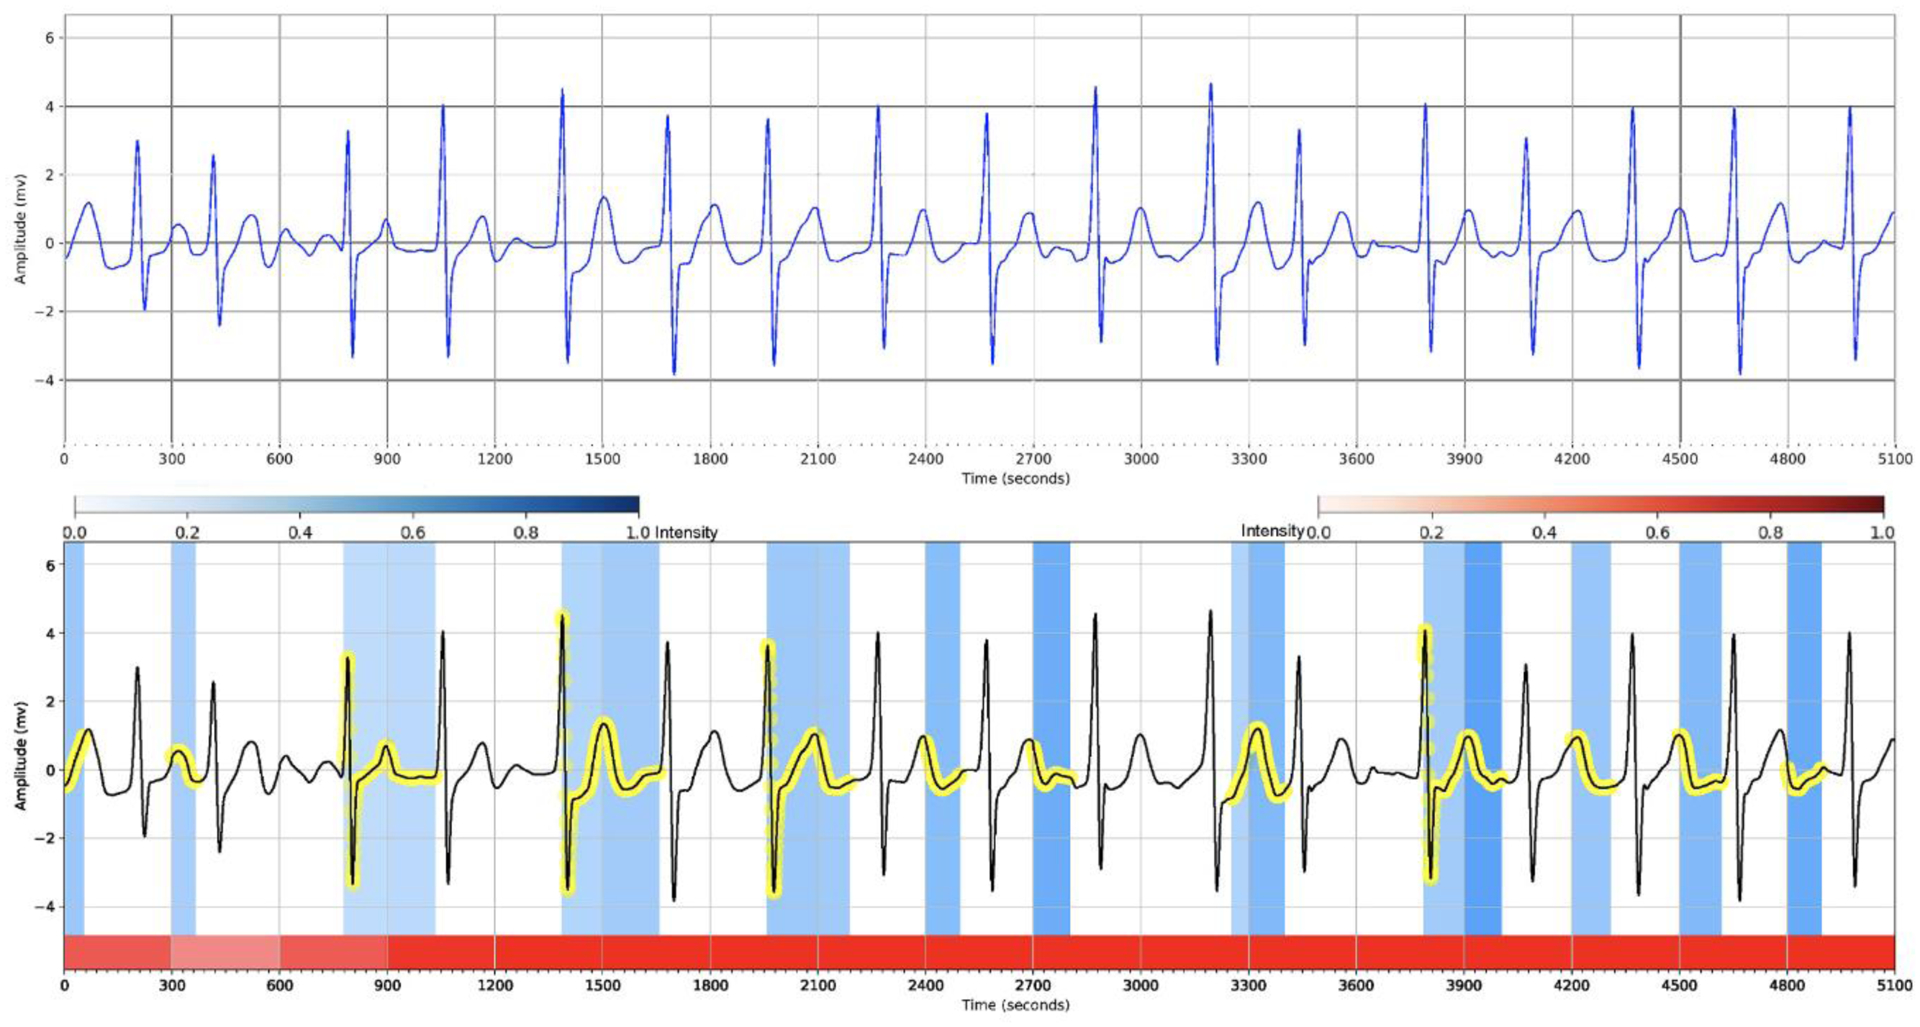
Fig. 5.

Hierarchical attention visualization of a subject with the AF arrhythmia from the PhysioNet Computing in Cardiology Challenge 2017 dataset. The red segments depict the heartbeat weights and darker ones present more important heartbeats on the network’s decision, and the blue strips and the yellow circles depict the locations of the important waves of the heartbeats in which the darker blue ones show more influence on the detection process.
