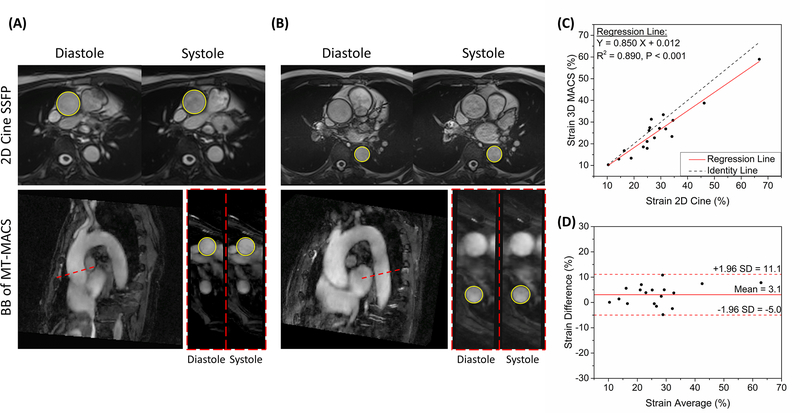
Figure 6.
Quantification of the functional parameter of aortic vessels. (A)(B) Graphic illustration of measuring the diastolic and systolic lumen area of both the ascending and descending aortas in healthy subjects. The lumen boundaries were manually traced on 2D cine SSFP images and bright-blood images of MT-MACS. Both the slice position and slice thickness were matched during the measurements. (C) Comparison of aortic vessel strain measurement, using the proposed MT-MACS and a convention 2D cine reference. The black dotted line represents identity line (Y = X), while the solid red line stands for regression of the results from these 2 methods. The intraclass correlation coefficient (ICC) was 0.947 (P < 0.001). (D) Bland-Altman plots comparing measurement results acquired by these two imaging techniques. Solid red line and dashed red lines indicate the mean and standard deviation of strain values between different methods.

