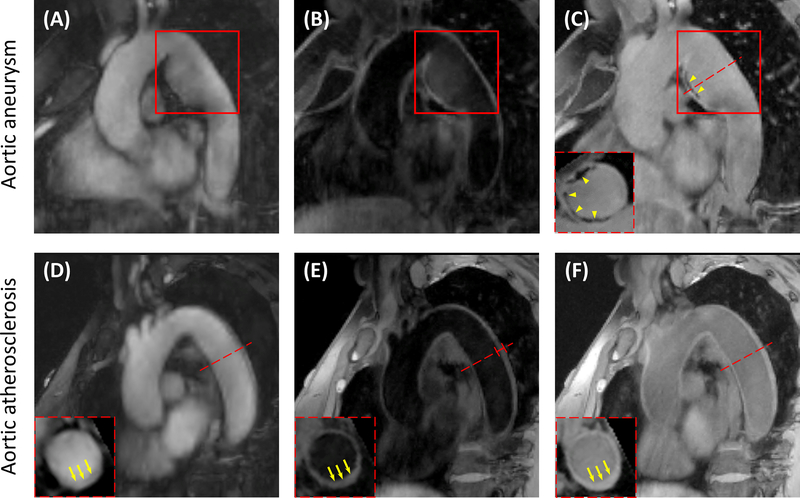
Figure 7.
Images from two patients with aortic aneurysm and aortic atherosclerosis, respectively. (A) Bright-blood, (B) dark-blood and (C) gray-blood contrast weightings from a 38-year-old female patient with aortic aneurysm. Aneurysm in the patient’s descending aorta was depicted (red boxes). Calcifications were also identified by GB imaging and the circumferential extent of the abnormalities could be seen through short-axis views (yellow arrowheads). (D) Bright-blood, (E) dark-blood and (F) gray-blood images acquired from a 71-year-old female patient with aortic atherosclerosis. Increased aortic wall thickness (4.491 mm) was marked out in red on the oblique sagittal dark-blood image. The severe thickening of the vessel wall could be clearly identified through the short-axis views of the DB and GB imaging, which were pointed out by the yellow arrows.

