Figure 1.

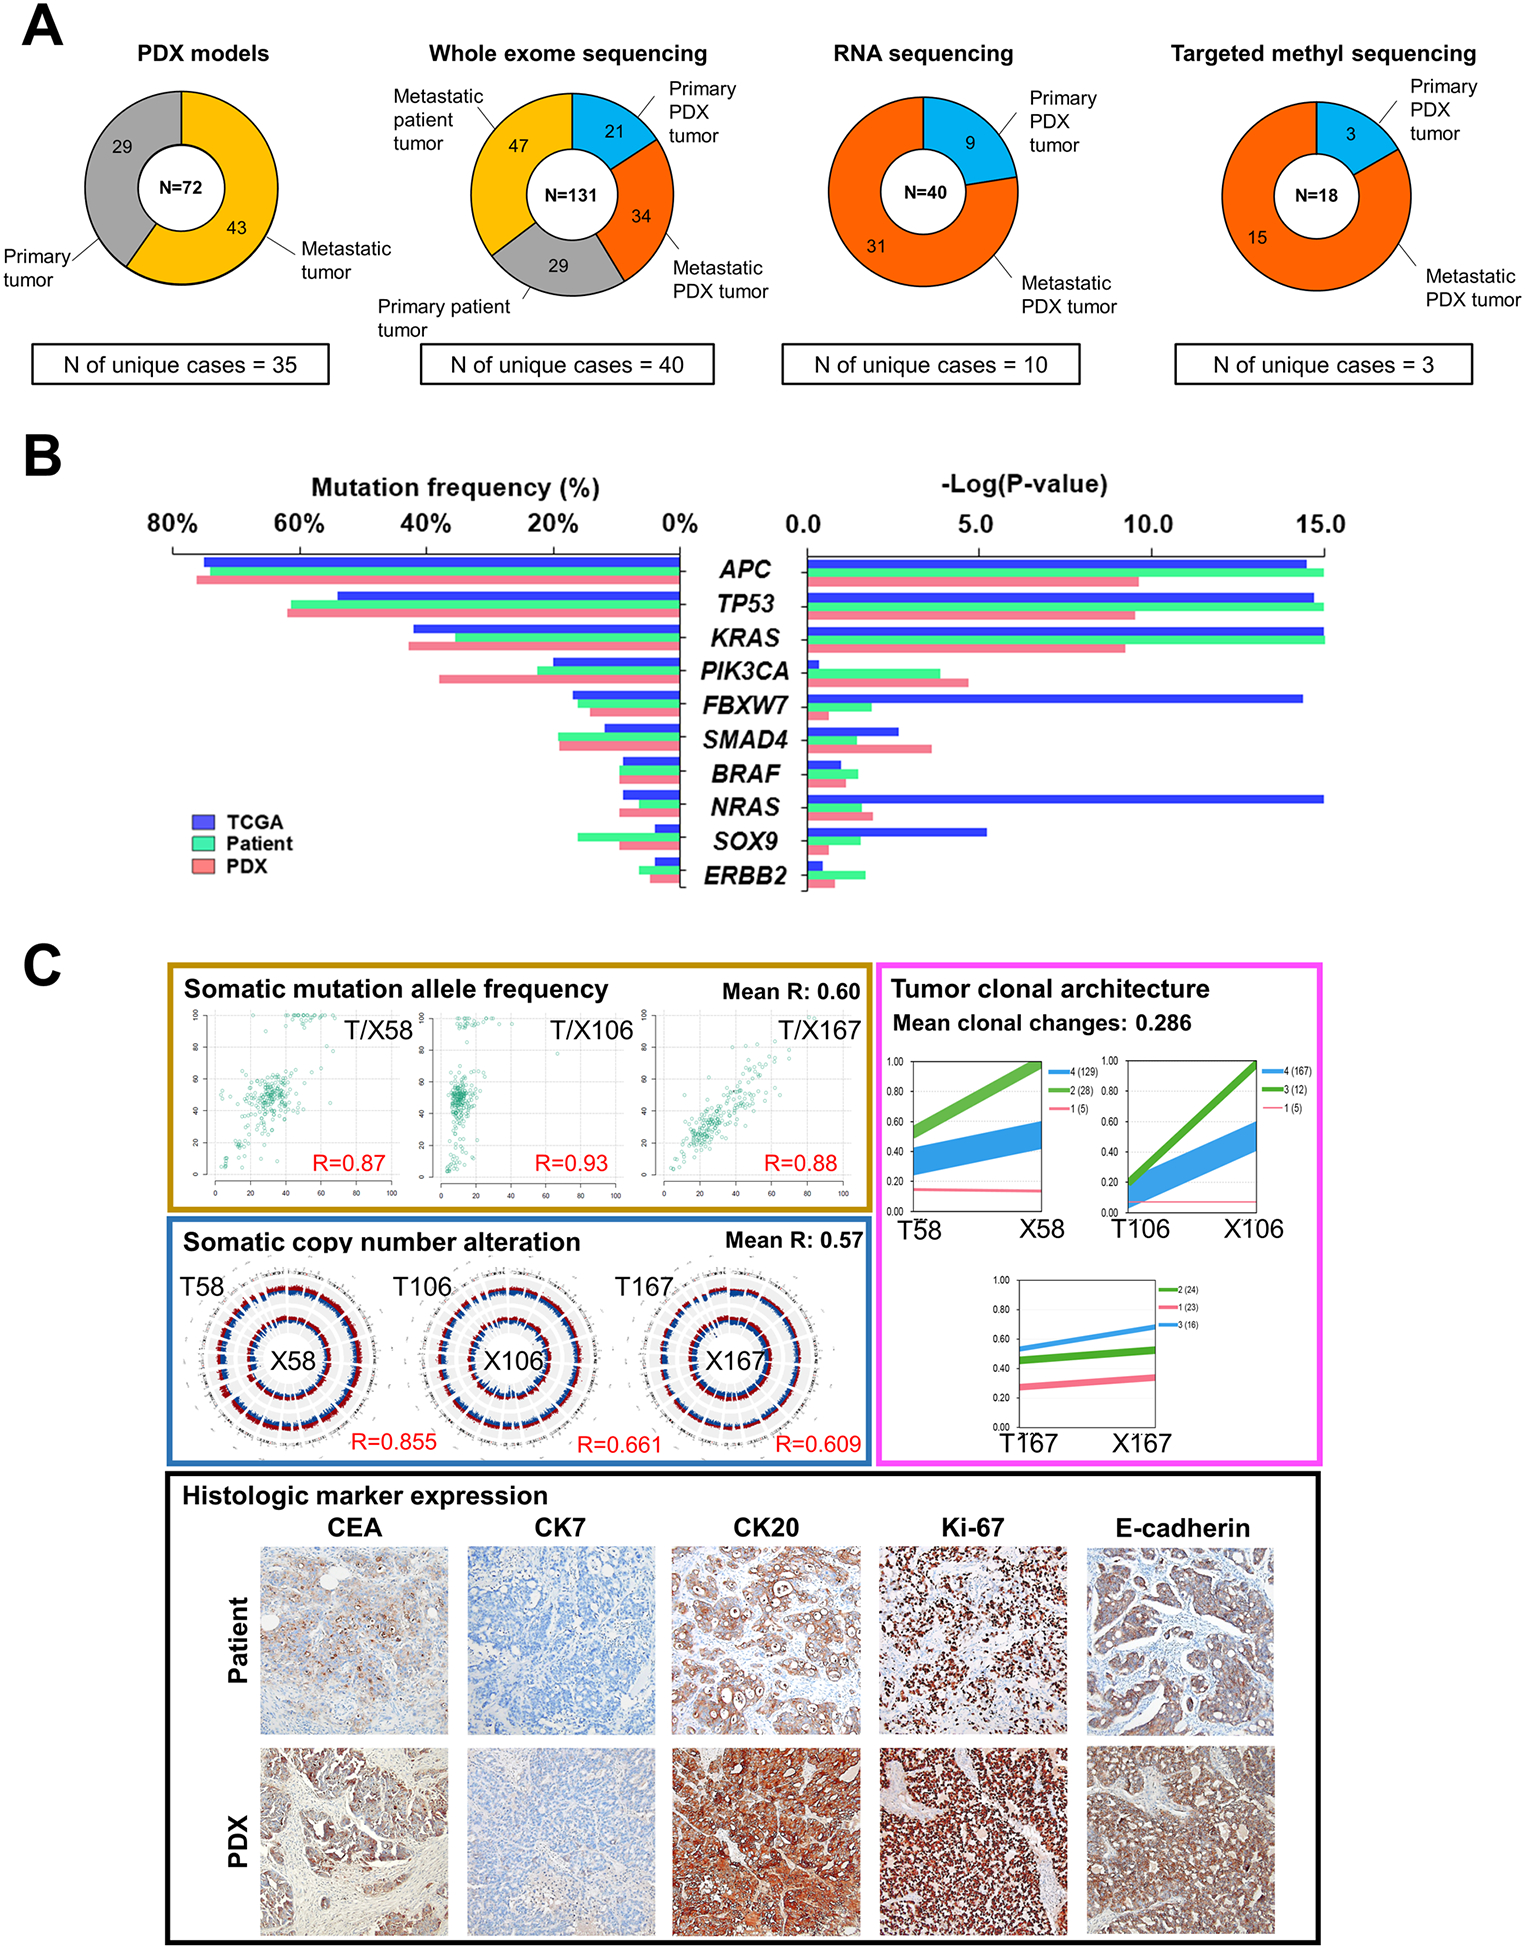
Genomic characterization of PDX tumors of CRCs. A, Summary of sample composition for PDX generation, whole exome sequencing, RNA sequencing and DNA targeted methyl-capture sequencing. B, Distribution of the mutation frequencies of the top 10 significantly-mutated cancer genes from the TCGA cohort (n = 224; blue), primary tumors of our patient cohort (n = 29; green) and primary tumors of our PDX cohort (n = 18; pink). Left panel represents the frequency of mutations from three cohorts, calculated by considering only primary tumors. Right panel shows P-values of each gene estimated by the MutSig algorithm. C, Panels with individual examples for comparison between matched patient and PDX tumors. Left upper panel contains scatterplots of somatic mutation allele frequencies of matched samples, and left middle panel represents genomic distribution of somatic copy number alterations (red region, amplification; blue region, deletion) in matched patient (outer circle) and PDX (inner circle) tumors. Right upper panel shows tumor clonal architecture of matched patient and PDX tumors, estimated by PyClone algorithm. Line widths indicate the number of mutations in each cluster (numbers in brackets next to each cluster). Lower panel is the representative microscopic images of immunohistological analysis in matched patient and PDX tumors (100X). Immunohistochemical staining were performed for carcinoembryonic antigen (CEA), cytokeratin 7 (CK7), CK20, Ki-67, and E-cadherin.
