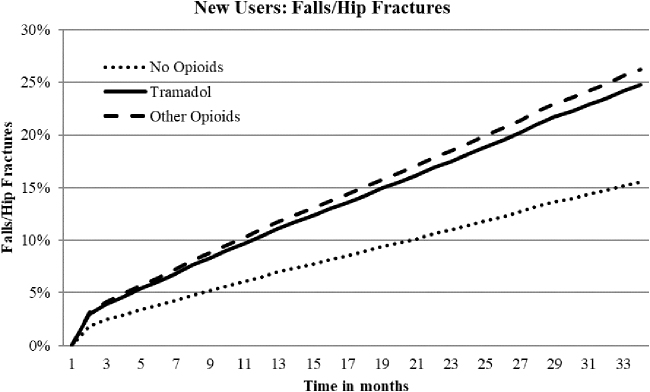
FIG. 1.
Adjusted time to event curves for falls/fractures for new tramadol and other opioid use vs. no opioids. Curves were regression adjusted with variables from Table 2. Tramadol vs. no opioids HR 1.59, P < 0.0001; other opioids vs. no opioids HR 1.69, P < 0.0001; Tramadol vs. other opioids HR 0.95, P = 0.02. HR, hazard ratio.

