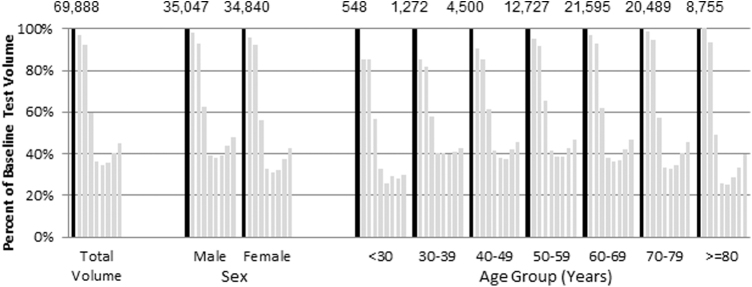
FIG. 1.
Weekly hemoglobin A1c testing among patients presumed to have diabetes, by sex and age groups. Black bar represents the average of baseline weekly testing volume for 60 weeks prior to March 1, 2020, for the various sex and age groupings. The numbers at the top of the chart are the baseline weekly testing volumes. The x-axis is volume in successive weeks (week 1–8) relative to baseline; March 1–7 is week 1. The y-axis depicts the weekly volumes for each category relative to the baseline weekly test volumes in percentage terms.

